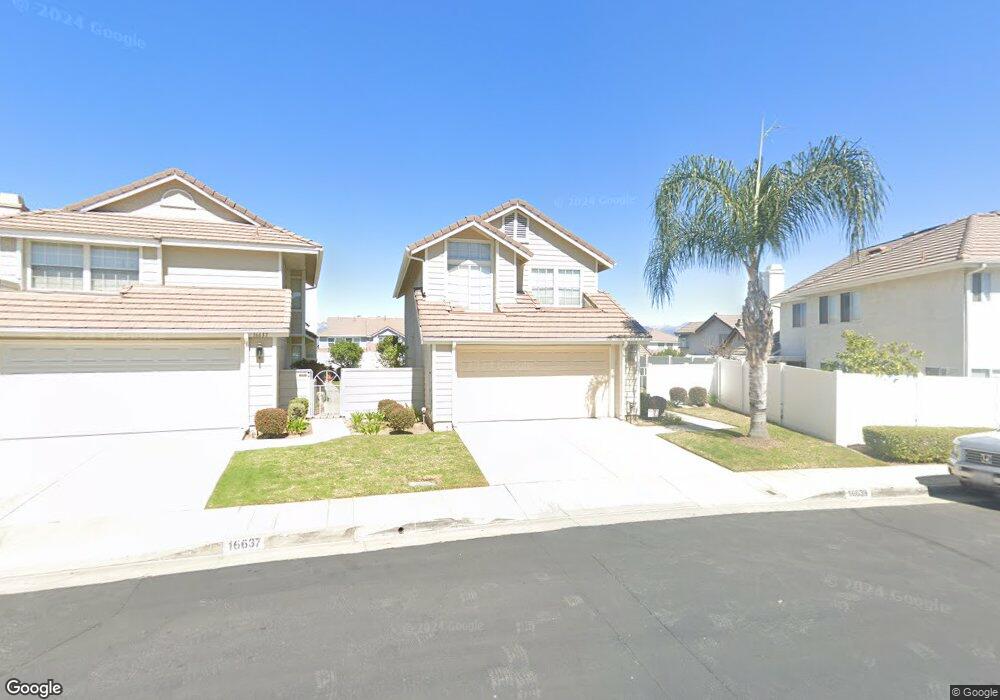
16639 Carriage Place Unit 143 Hacienda Heights, CA 91745
Estimated Value: $672,000 - $724,217
3
Beds
3
Baths
1,402
Sq Ft
$498/Sq Ft
Est. Value
About This Home
This home is located at 16639 Carriage Place Unit 143, Hacienda Heights, CA 91745 and is currently estimated at $697,804, approximately $497 per square foot. 16639 Carriage Place Unit 143 is a home located in Los Angeles County with nearby schools including Bixby Elementary School, Cedarlane Academy, and Glen A. Wilson High School.
Ownership History
Date
Name
Owned For
Owner Type
Purchase Details
Closed on
Aug 16, 2022
Sold by
Sandra Hata
Bought by
Sandra Hata Separate Property Trust
Current Estimated Value
Purchase Details
Closed on
May 15, 2006
Sold by
Iwasaki Kenichi
Bought by
Iwasaki Ken
Purchase Details
Closed on
Feb 15, 1996
Sold by
Uchida Yasutomo and Uchida Masako
Bought by
Iwasaki Kenichi
Home Financials for this Owner
Home Financials are based on the most recent Mortgage that was taken out on this home.
Original Mortgage
$116,000
Interest Rate
7.1%
Purchase Details
Closed on
Apr 19, 1994
Sold by
Uchida Yasutomo
Bought by
Uchida Yasutomo
Home Financials for this Owner
Home Financials are based on the most recent Mortgage that was taken out on this home.
Original Mortgage
$80,000
Interest Rate
7.67%
Create a Home Valuation Report for This Property
The Home Valuation Report is an in-depth analysis detailing your home's value as well as a comparison with similar homes in the area
Home Values in the Area
Average Home Value in this Area
Purchase History
| Date | Buyer | Sale Price | Title Company |
|---|---|---|---|
| Sandra Hata Separate Property Trust | -- | None Listed On Document | |
| Iwasaki Ken | -- | None Available | |
| Iwasaki Kenichi | $176,000 | American Title Ins Co | |
| Uchida Yasutomo | -- | Benefit Land Title |
Source: Public Records
Mortgage History
| Date | Status | Borrower | Loan Amount |
|---|---|---|---|
| Previous Owner | Iwasaki Kenichi | $116,000 | |
| Previous Owner | Uchida Yasutomo | $80,000 |
Source: Public Records
Tax History Compared to Growth
Tax History
| Year | Tax Paid | Tax Assessment Tax Assessment Total Assessment is a certain percentage of the fair market value that is determined by local assessors to be the total taxable value of land and additions on the property. | Land | Improvement |
|---|---|---|---|---|
| 2025 | $5,916 | $479,604 | $258,457 | $221,147 |
| 2024 | $5,916 | $470,201 | $253,390 | $216,811 |
| 2023 | $5,768 | $460,982 | $248,422 | $212,560 |
| 2022 | $5,595 | $451,944 | $243,551 | $208,393 |
| 2021 | $5,493 | $443,083 | $238,776 | $204,307 |
| 2019 | $5,331 | $429,944 | $231,695 | $198,249 |
| 2018 | $5,158 | $421,514 | $227,152 | $194,362 |
| 2016 | $4,773 | $405,148 | $218,333 | $186,815 |
| 2015 | $4,686 | $399,063 | $215,054 | $184,009 |
| 2014 | $4,610 | $391,247 | $210,842 | $180,405 |
Source: Public Records
Map
Nearby Homes
- 16500 Ember Glen Rd
- 2021 Elderway Dr
- 1740 Rada Rd
- 1804 Ewing Ct
- 1607 Waverly Glen Way
- 1831 Ewing Ct Unit 32
- 1433 Eagle Park Rd Unit 167
- 16495 Canelones Dr
- 1469 Forest Glen Dr Unit 193
- 17078 Colima Rd Unit 323
- 2367 Mountain Brook Dr
- 2082 Salto Dr
- 2122 Marblecrest Dr
- 1426 Countrywood Ave Unit 51
- 1440 Forest Glen Dr
- 1401 Eagle Park Rd Unit 101
- 1414 Countrywood Ave Unit 91
- 17070 Colima Rd Unit 284
- 2521 Mountainview Ct
- 16390 Gregorio Dr
- 16644 Surrey Place
- 16633 Carriage Place
- 1627 Coach Place
- 16631 Carriage Place
- 1614 Coach Place
- 16653 Surrey Place
- 16643 Surrey Place
- 16642 Surrey Place Unit 149
- 1621 Coach Place
- 1616 Coach Place
- 16637 Carriage Place Unit 141
- 16655 Surrey Place Unit 154
- 16649 Surrey Place
- 16645 Surrey Place
- 1615 Coach Place
- 1625 Coach Place
- 16627 Carriage Place
- 16638 Carriage Place
- 16622 Surrey Place
- 16624 Surrey Place Unit 124