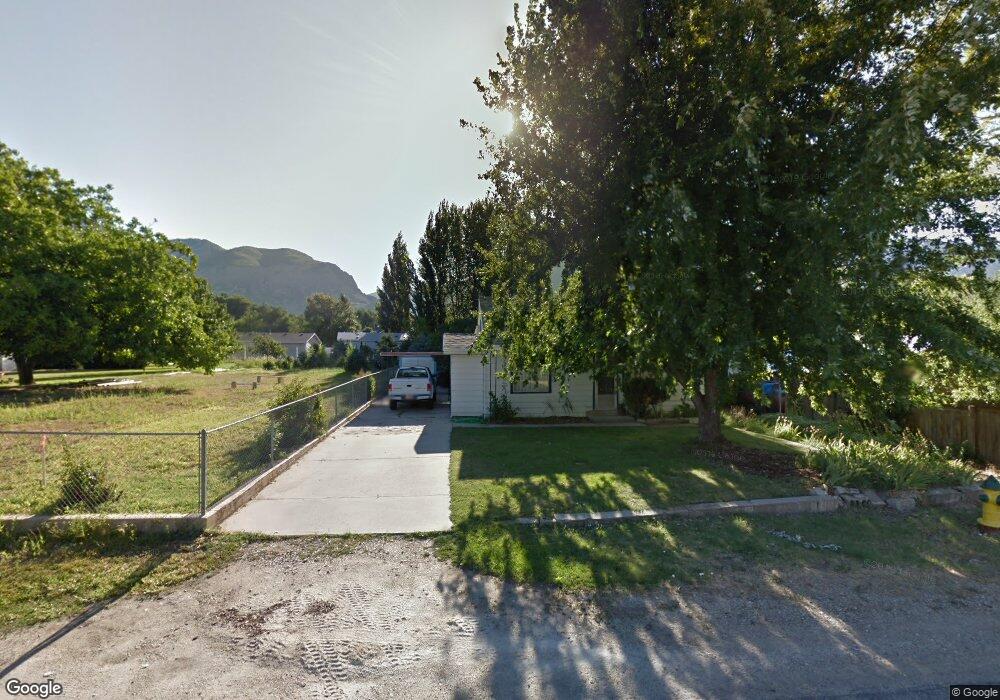
1664 Fowler Ave Ogden, UT 84404
Canyon Road NeighborhoodEstimated Value: $394,000 - $443,189
3
Beds
2
Baths
2,318
Sq Ft
$184/Sq Ft
Est. Value
About This Home
This home is located at 1664 Fowler Ave, Ogden, UT 84404 and is currently estimated at $425,547, approximately $183 per square foot. 1664 Fowler Ave is a home located in Weber County with nearby schools including New Bridge School, Mound Fort Junior High School, and Ben Lomond High School.
Ownership History
Date
Name
Owned For
Owner Type
Purchase Details
Closed on
May 14, 2020
Sold by
Mach Jeffrey M
Bought by
Miller Jeffrey M
Current Estimated Value
Home Financials for this Owner
Home Financials are based on the most recent Mortgage that was taken out on this home.
Original Mortgage
$261,250
Outstanding Balance
$231,504
Interest Rate
3.3%
Mortgage Type
New Conventional
Estimated Equity
$194,043
Purchase Details
Closed on
Dec 30, 2010
Sold by
Alexander Annette Slade and Alexander Clyde L
Bought by
Mach Jeffrey M
Home Financials for this Owner
Home Financials are based on the most recent Mortgage that was taken out on this home.
Original Mortgage
$131,577
Interest Rate
4.75%
Mortgage Type
FHA
Purchase Details
Closed on
Jun 4, 1996
Sold by
Slade Clyde L and Slade Erma M
Bought by
Buttars Dallas K and Syme Alford D
Home Financials for this Owner
Home Financials are based on the most recent Mortgage that was taken out on this home.
Original Mortgage
$44,034
Interest Rate
7.96%
Mortgage Type
Seller Take Back
Create a Home Valuation Report for This Property
The Home Valuation Report is an in-depth analysis detailing your home's value as well as a comparison with similar homes in the area
Home Values in the Area
Average Home Value in this Area
Purchase History
| Date | Buyer | Sale Price | Title Company |
|---|---|---|---|
| Miller Jeffrey M | -- | Mountain View Title Ogden | |
| Mach Jeffrey M | -- | Cache Title Logan | |
| Mach Jeffrey M | -- | Cache Title Logan | |
| Buttars Dallas K | -- | U S Title |
Source: Public Records
Mortgage History
| Date | Status | Borrower | Loan Amount |
|---|---|---|---|
| Open | Miller Jeffrey M | $261,250 | |
| Closed | Mach Jeffrey M | $131,577 | |
| Previous Owner | Buttars Dallas K | $44,034 |
Source: Public Records
Tax History
| Year | Tax Paid | Tax Assessment Tax Assessment Total Assessment is a certain percentage of the fair market value that is determined by local assessors to be the total taxable value of land and additions on the property. | Land | Improvement |
|---|---|---|---|---|
| 2025 | $3,121 | $457,567 | $149,857 | $307,710 |
| 2024 | $2,959 | $234,299 | $70,782 | $163,517 |
| 2023 | $2,885 | $229,900 | $62,610 | $167,290 |
| 2022 | $2,761 | $220,550 | $51,368 | $169,182 |
| 2021 | $2,413 | $320,000 | $57,784 | $262,216 |
| 2020 | $2,172 | $266,000 | $45,482 | $220,518 |
| 2019 | $2,261 | $260,000 | $39,275 | $220,725 |
| 2018 | $1,960 | $224,000 | $34,790 | $189,210 |
| 2017 | $1,724 | $184,000 | $34,790 | $149,210 |
| 2016 | $1,602 | $92,443 | $18,280 | $74,163 |
| 2015 | $1,378 | $77,602 | $18,280 | $59,322 |
| 2014 | $1,406 | $77,708 | $18,280 | $59,428 |
Source: Public Records
Map
Nearby Homes
- 1687 Kylee Ln
- 1027 Sara Ln
- 954 16th St Unit 68
- 1068 16th St
- 1095 16th St Unit 2
- 802 Canyon Rd
- 947 Canyon Rd Unit 15
- 793 E 1500 St S
- 1849 Van Buren Ave
- 1014 Creekside Dr
- 1502 Liberty Ave
- 1167 16th St
- 1305 Monroe Blvd Unit 2
- 1435 S 1195 E Unit 19
- 1266 S 950 E Unit 22
- 1120 Canyon Rd Unit 38
- 1120 Canyon Rd Unit 28
- 1120 Canyon Rd Unit 16
- 1324 Liberty Ave
- 1175 Canyon Rd Unit 80
- 1664 Fowler Ave
- 1670 Fowler Ave
- 1650 Fowler Ave
- 1675 Kylee Ln
- 1675 Kylee Ln Unit 3
- 1665 Kylee Ln
- 1681 Kylee Ln
- 1681 Kylee Ln Unit 2
- 1659 Kylee Ln
- 1659 Kylee Ln Unit 5
- 1679 Fowler Ave
- 1642 Kylee Ln
- 1677 Fowler Ave
- 1681 Fowler Ave
- 1682 Fowler Ave
- 1682 Fowler Ave
- 1642 Fowler Ave
- 1642 Fowler Ave
- 972 Kylee Ln
- 978 Kylee Ln
Your Personal Tour Guide
Ask me questions while you tour the home.