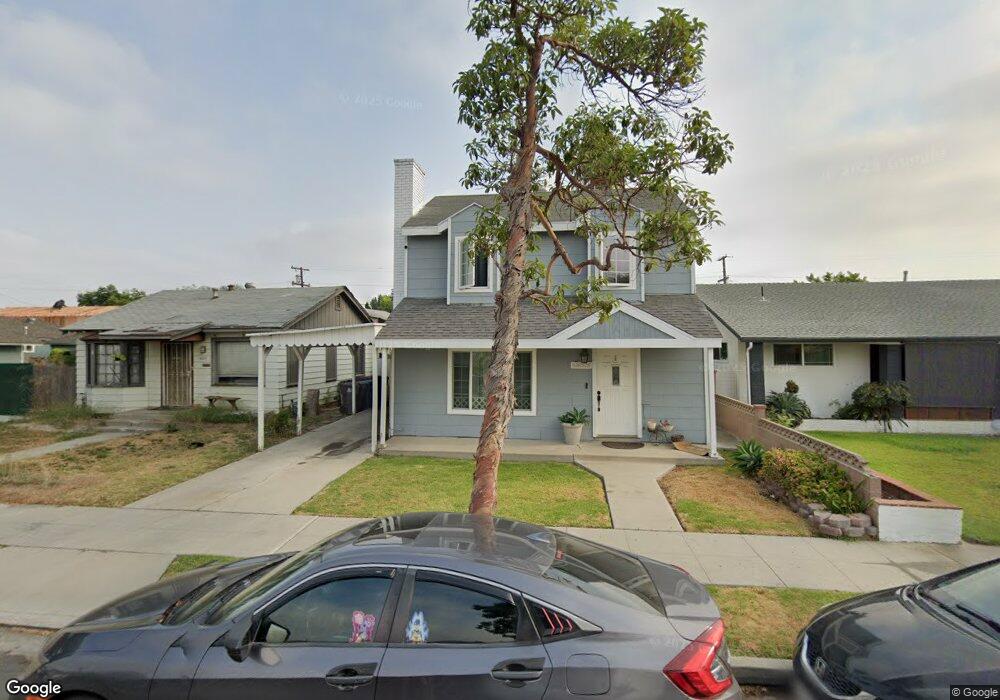
1665 E 53rd St Long Beach, CA 90805
Lindbergh NeighborhoodEstimated Value: $771,000 - $842,000
4
Beds
2
Baths
1,486
Sq Ft
$546/Sq Ft
Est. Value
About This Home
This home is located at 1665 E 53rd St, Long Beach, CA 90805 and is currently estimated at $811,200, approximately $545 per square foot. 1665 E 53rd St is a home located in Los Angeles County with nearby schools including Barton Elementary School, Lindbergh STEM Academy, and Jordan High School.
Ownership History
Date
Name
Owned For
Owner Type
Purchase Details
Closed on
Mar 22, 1999
Sold by
Washington Mutual Bank Fa
Bought by
Rodriguez Oscar and Rodriguez Rosana
Current Estimated Value
Home Financials for this Owner
Home Financials are based on the most recent Mortgage that was taken out on this home.
Original Mortgage
$155,103
Outstanding Balance
$37,659
Interest Rate
7.04%
Mortgage Type
Seller Take Back
Estimated Equity
$773,541
Purchase Details
Closed on
Aug 18, 1998
Sold by
Edwards James
Bought by
Washington Mutual Bank Fa
Purchase Details
Closed on
Jan 15, 1994
Sold by
Roman Frank
Bought by
Edwards James and Ring Gary W
Create a Home Valuation Report for This Property
The Home Valuation Report is an in-depth analysis detailing your home's value as well as a comparison with similar homes in the area
Home Values in the Area
Average Home Value in this Area
Purchase History
| Date | Buyer | Sale Price | Title Company |
|---|---|---|---|
| Rodriguez Oscar | $160,000 | Fidelity National Title | |
| Washington Mutual Bank Fa | $93,623 | Fidelity National Title Ins | |
| Edwards James | -- | -- |
Source: Public Records
Mortgage History
| Date | Status | Borrower | Loan Amount |
|---|---|---|---|
| Open | Rodriguez Oscar | $155,103 |
Source: Public Records
Tax History
| Year | Tax Paid | Tax Assessment Tax Assessment Total Assessment is a certain percentage of the fair market value that is determined by local assessors to be the total taxable value of land and additions on the property. | Land | Improvement |
|---|---|---|---|---|
| 2025 | $8,907 | $671,106 | $487,093 | $184,013 |
| 2024 | $8,524 | $657,948 | $477,543 | $180,405 |
| 2023 | $8,383 | $645,048 | $468,180 | $176,868 |
| 2022 | $7,869 | $632,400 | $459,000 | $173,400 |
| 2021 | $3,089 | $231,570 | $106,589 | $124,981 |
| 2020 | $3,080 | $229,197 | $105,497 | $123,700 |
| 2019 | $3,046 | $224,704 | $103,429 | $121,275 |
| 2018 | $2,913 | $220,299 | $101,401 | $118,898 |
| 2016 | $2,675 | $211,746 | $97,464 | $114,282 |
| 2015 | $2,571 | $208,566 | $96,000 | $112,566 |
| 2014 | $2,559 | $204,481 | $94,120 | $110,361 |
Source: Public Records
Map
Nearby Homes
- 1648 E Plymouth St
- 1659 E Plymouth St
- 5131 Gaviota Ave
- 1921 E Washington St
- 1330 E 56th St
- 5497 Orange Ave
- 1414 E Silva St
- 5267 Meadow Wood Ave
- 5021 Brayton Ave
- 5493 Cerritos Ave
- 1709 E Luray St
- 5018 Elderhall Ave
- 2413 Denmead St
- 1429 E South St
- 5500 Ackerfield Ave Unit 501
- 5500 Ackerfield Ave Unit 412
- 5500 Ackerfield Ave Unit 307
- 5530 Ackerfield Ave Unit 314
- 5880 Gundry Ave
- 1615 E 59th St
- 1669 E 53rd St
- 1655 E 53rd St
- 1675 E 53rd St
- 1645 E 53rd St
- 1668 E Plymouth St
- 1658 E Plymouth St
- 1685 E 53rd St
- 1635 E 53rd St Unit 3
- 1635 E 53rd St
- 1680 E Plymouth St
- 1670 E 53rd St
- 1660 E 53rd St
- 1688 E Plymouth St
- 1680 E 53rd St
- 1629 E 53rd St
- 1701 E 53rd St
- 1638 E Plymouth St
- 1640 E Plymouth St
- 1650 E 53rd St
- 1688 E 53rd St
Your Personal Tour Guide
Ask me questions while you tour the home.