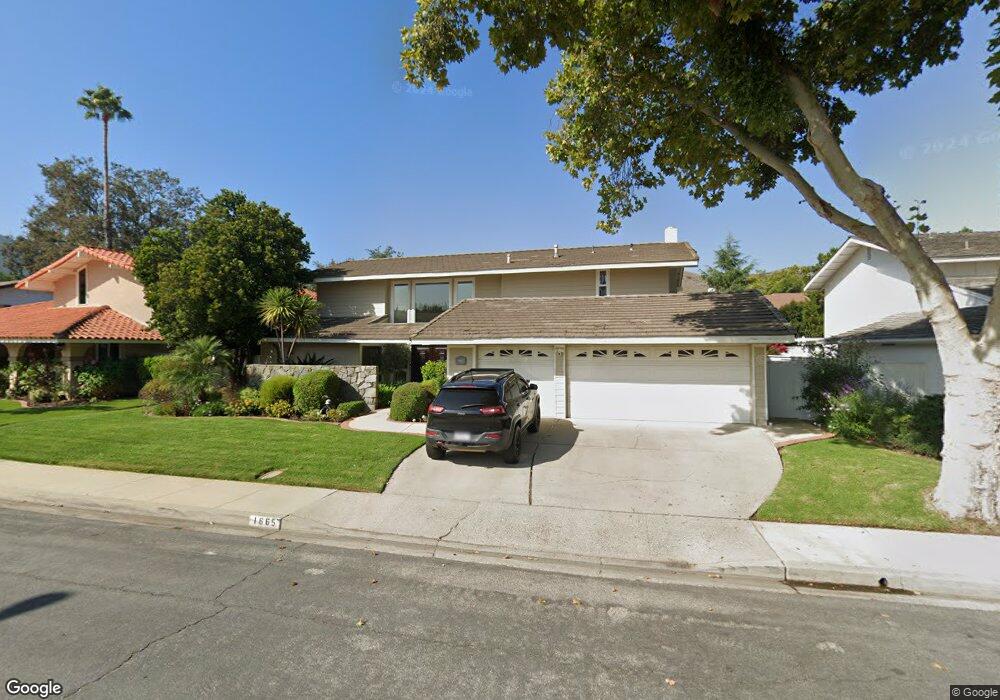
1665 Trafalgar Place Westlake Village, CA 91361
Estimated Value: $1,524,196 - $1,780,000
5
Beds
3
Baths
2,510
Sq Ft
$659/Sq Ft
Est. Value
About This Home
This home is located at 1665 Trafalgar Place, Westlake Village, CA 91361 and is currently estimated at $1,654,299, approximately $659 per square foot. 1665 Trafalgar Place is a home located in Ventura County with nearby schools including Westlake Elementary School, Colina Middle School, and Westlake High School.
Ownership History
Date
Name
Owned For
Owner Type
Purchase Details
Closed on
Apr 18, 2025
Sold by
Woodall Steve
Bought by
Woodall Alyssa
Current Estimated Value
Purchase Details
Closed on
May 4, 2000
Sold by
Deitemeyer Richard M and Deitemeyer Nancy G
Bought by
Woodall Steve and Woodall Alyssa
Home Financials for this Owner
Home Financials are based on the most recent Mortgage that was taken out on this home.
Original Mortgage
$347,500
Interest Rate
8.37%
Purchase Details
Closed on
Aug 26, 1997
Sold by
Deitemeyer Richard M and Deitemeyer Nancy G
Bought by
Deitemeyer Richard M and Deitemeyer Nancy G
Purchase Details
Closed on
Aug 4, 1994
Sold by
Dixon Robert L and Dixon Eve
Bought by
Deitemeyer Richard M and Deitemeyer Nancy G
Home Financials for this Owner
Home Financials are based on the most recent Mortgage that was taken out on this home.
Original Mortgage
$275,000
Interest Rate
8.65%
Create a Home Valuation Report for This Property
The Home Valuation Report is an in-depth analysis detailing your home's value as well as a comparison with similar homes in the area
Home Values in the Area
Average Home Value in this Area
Purchase History
| Date | Buyer | Sale Price | Title Company |
|---|---|---|---|
| Woodall Alyssa | -- | None Listed On Document | |
| Woodall Steve | $447,500 | Progressive Title Company | |
| Deitemeyer Richard M | -- | -- | |
| Deitemeyer Richard M | $346,000 | First American Title Ins Co |
Source: Public Records
Mortgage History
| Date | Status | Borrower | Loan Amount |
|---|---|---|---|
| Previous Owner | Woodall Steve | $347,500 | |
| Previous Owner | Deitemeyer Richard M | $275,000 |
Source: Public Records
Tax History Compared to Growth
Tax History
| Year | Tax Paid | Tax Assessment Tax Assessment Total Assessment is a certain percentage of the fair market value that is determined by local assessors to be the total taxable value of land and additions on the property. | Land | Improvement |
|---|---|---|---|---|
| 2025 | $8,726 | $687,774 | $275,107 | $412,667 |
| 2024 | $8,726 | $674,289 | $269,713 | $404,576 |
| 2023 | $8,453 | $661,068 | $264,424 | $396,644 |
| 2022 | $8,159 | $648,106 | $259,239 | $388,867 |
| 2021 | $7,891 | $635,399 | $254,156 | $381,243 |
| 2020 | $7,674 | $628,885 | $251,550 | $377,335 |
| 2019 | $7,385 | $616,555 | $246,618 | $369,937 |
| 2018 | $7,191 | $604,467 | $241,783 | $362,684 |
| 2017 | $7,007 | $592,616 | $237,043 | $355,573 |
| 2016 | $6,908 | $580,997 | $232,396 | $348,601 |
| 2015 | $6,761 | $572,271 | $228,906 | $343,365 |
| 2014 | $6,638 | $561,063 | $224,423 | $336,640 |
Source: Public Records
Map
Nearby Homes
- 1641 Trafalgar Place
- 1694 Margate Place
- 1653 Vista Oaks Way
- 1535 Verde Ridge Ln
- 930 Ravensbury St
- 461 Lake Sherwood Dr
- 844 Lake Sherwood Dr
- 1501 Valecroft Ave
- 1589 Brentford Ave
- 2112 Trentham Rd
- 1440 Cheswick Place
- 1660 Valecroft Ave
- 590 Cricketfield Ct
- 534 Ravensbury St
- 490 Ravensbury St
- 2039 Channelford Rd
- 2385 Calbourne Ct
- 1787 Sandcroft St
- 1613 Oakcottage Ct
- 1653 Trafalgar Place
- 1677 Trafalgar Place
- 1658 Cromwell Place
- 1664 Cromwell Place
- 1646 Cromwell Place
- 1654 Trafalgar Place
- 1666 Trafalgar Place
- 1681 Trafalgar Place
- 1642 Trafalgar Place
- 1676 Cromwell Place
- 1642 Cromwell Place
- 1678 Trafalgar Place
- 1630 Trafalgar Place
- 1688 Cromwell Place
- 1682 Trafalgar Place
- 1693 Trafalgar Place
- 1659 Cromwell Place
- 1649 Oldcastle Place
- 1657 Oldcastle Place
- 1647 Cromwell Place