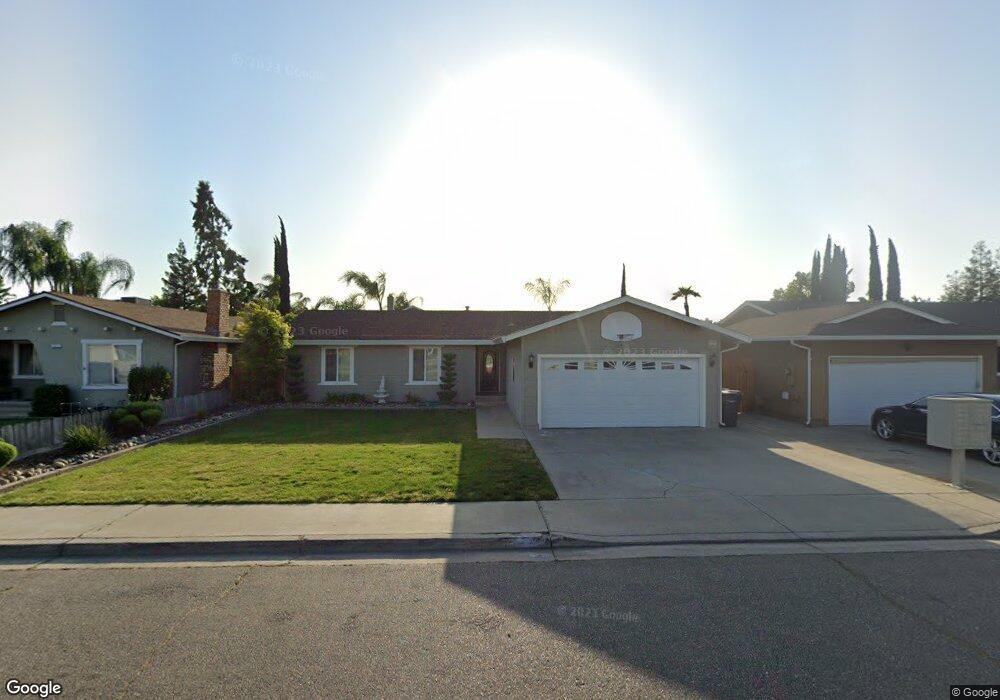
1665 Wagner Dr Turlock, CA 95380
Estimated Value: $224,000 - $434,000
3
Beds
2
Baths
1,256
Sq Ft
$296/Sq Ft
Est. Value
About This Home
This home is located at 1665 Wagner Dr, Turlock, CA 95380 and is currently estimated at $371,245, approximately $295 per square foot. 1665 Wagner Dr is a home located in Stanislaus County with nearby schools including Cunningham Elementary School, Marvin A. Dutcher Middle School, and Turlock Junior High School.
Ownership History
Date
Name
Owned For
Owner Type
Purchase Details
Closed on
Jan 28, 2014
Sold by
Handwerk John and Oliveira Rosemary
Bought by
Oliveira Rosemary
Current Estimated Value
Purchase Details
Closed on
Jul 27, 1998
Sold by
Gough Teryl Joy and Broekemeier Loy L
Bought by
Handwerk John and Oliveira Rosemary
Home Financials for this Owner
Home Financials are based on the most recent Mortgage that was taken out on this home.
Original Mortgage
$76,687
Outstanding Balance
$15,571
Interest Rate
6.91%
Mortgage Type
FHA
Estimated Equity
$355,674
Purchase Details
Closed on
Dec 8, 1993
Sold by
Broekemeier Karen S
Bought by
Broekemeier Loy L
Home Financials for this Owner
Home Financials are based on the most recent Mortgage that was taken out on this home.
Original Mortgage
$76,500
Interest Rate
3.87%
Create a Home Valuation Report for This Property
The Home Valuation Report is an in-depth analysis detailing your home's value as well as a comparison with similar homes in the area
Purchase History
| Date | Buyer | Sale Price | Title Company |
|---|---|---|---|
| Oliveira Rosemary | -- | None Available | |
| Handwerk John | $95,000 | Chicago Title Co | |
| Broekemeier Loy L | -- | Fidelity National Title | |
| Gough Teryl Joy | -- | Fidelity National Title |
Source: Public Records
Mortgage History
| Date | Status | Borrower | Loan Amount |
|---|---|---|---|
| Open | Handwerk John | $76,687 | |
| Previous Owner | Gough Teryl Joy | $76,500 | |
| Closed | Handwerk John | $20,000 |
Source: Public Records
Tax History
| Year | Tax Paid | Tax Assessment Tax Assessment Total Assessment is a certain percentage of the fair market value that is determined by local assessors to be the total taxable value of land and additions on the property. | Land | Improvement |
|---|---|---|---|---|
| 2025 | $2,138 | $199,119 | $60,284 | $138,835 |
| 2024 | $2,099 | $195,215 | $59,102 | $136,113 |
| 2023 | $2,095 | $191,389 | $57,944 | $133,445 |
| 2022 | $2,069 | $187,637 | $56,808 | $130,829 |
| 2021 | $2,039 | $183,959 | $55,695 | $128,264 |
| 2020 | $1,947 | $182,073 | $55,124 | $126,949 |
| 2019 | $1,913 | $178,504 | $54,044 | $124,460 |
| 2018 | $1,910 | $175,005 | $52,985 | $122,020 |
| 2017 | $1,864 | $171,575 | $51,947 | $119,628 |
| 2016 | $1,814 | $168,212 | $50,929 | $117,283 |
| 2015 | $1,723 | $165,686 | $50,164 | $115,522 |
| 2014 | $1,436 | $137,881 | $38,363 | $99,518 |
Source: Public Records
Map
Nearby Homes
- 1165 Boxwood Way
- 901 Lavon New Ln
- 432 E Glenwood Ave
- 1202 Impression St
- 2333 Lander Ave
- 1070 5th St
- 440 Lemongrass St
- 449 Lemongrass St
- 436 Lemongrass St
- 437 Lemongrass St
- 799 8th St
- 1291 Lander Ave
- 1412 E Glenwood Ave
- 1412 S 1st St Unit B
- 228 H St
- 1044 Bethany Ave
- 205 G St
- 237 Bernell Ave
- 102 I St
- 218 E Greenway Ave
- 1655 Wagner Dr
- 1675 Wagner Dr
- 1676 Fernwood Dr
- 1670 Fernwood Dr
- 1680 Fernwood Dr
- 1645 Wagner Dr
- 1685 Wagner Dr
- 1660 Fernwood Dr
- 1690 Fernwood Dr
- 1650 Fernwood Dr
- 1660 Wagner Dr
- 1635 Wagner Dr
- 1650 Wagner Dr
- 1670 Wagner Dr
- 1696 Fernwood Dr
- 1695 Wagner Dr
- 1646 Fernwood Dr
- 1640 Wagner Dr
- 1680 Wagner Dr
- 1625 Wagner Dr
Your Personal Tour Guide
Ask me questions while you tour the home.