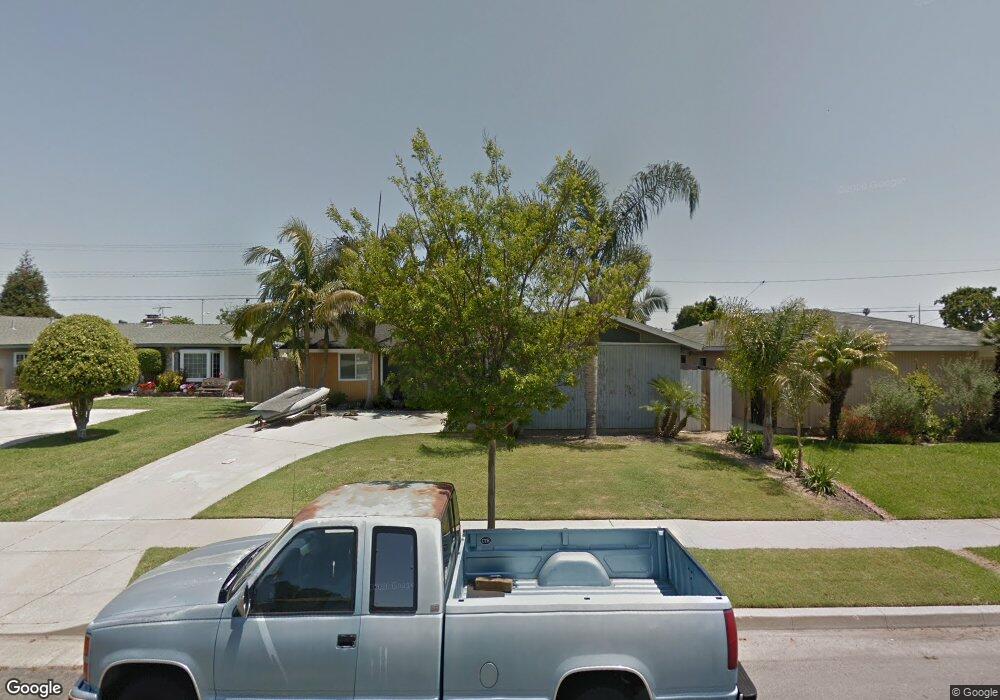
16652 Simmone Ln Huntington Beach, CA 92647
Estimated Value: $1,096,000 - $1,219,000
3
Beds
2
Baths
1,240
Sq Ft
$932/Sq Ft
Est. Value
About This Home
This home is located at 16652 Simmone Ln, Huntington Beach, CA 92647 and is currently estimated at $1,155,968, approximately $932 per square foot. 16652 Simmone Ln is a home located in Orange County with nearby schools including College View Elementary School, Spring View Middle School, and Ocean View High.
Ownership History
Date
Name
Owned For
Owner Type
Purchase Details
Closed on
Dec 22, 2010
Sold by
Fonnesbeck Gary O and Fonnesbeck Gary
Bought by
Fonnesbeck Gary O
Current Estimated Value
Home Financials for this Owner
Home Financials are based on the most recent Mortgage that was taken out on this home.
Original Mortgage
$57,500
Outstanding Balance
$36,574
Interest Rate
3.5%
Mortgage Type
New Conventional
Estimated Equity
$1,119,394
Purchase Details
Closed on
Aug 30, 1999
Sold by
Robert Franek
Bought by
Fonnesbeck Gary
Home Financials for this Owner
Home Financials are based on the most recent Mortgage that was taken out on this home.
Original Mortgage
$100,000
Outstanding Balance
$30,261
Interest Rate
8.09%
Estimated Equity
$1,125,707
Purchase Details
Closed on
Aug 8, 1996
Sold by
Higdon Kevin R
Bought by
Franek Robert A
Home Financials for this Owner
Home Financials are based on the most recent Mortgage that was taken out on this home.
Original Mortgage
$184,500
Interest Rate
8.23%
Create a Home Valuation Report for This Property
The Home Valuation Report is an in-depth analysis detailing your home's value as well as a comparison with similar homes in the area
Home Values in the Area
Average Home Value in this Area
Purchase History
| Date | Buyer | Sale Price | Title Company |
|---|---|---|---|
| Fonnesbeck Gary O | -- | Lsi | |
| Fonnesbeck Gary | $258,000 | North American Title Co | |
| Franek Robert A | $205,000 | North American Title Co |
Source: Public Records
Mortgage History
| Date | Status | Borrower | Loan Amount |
|---|---|---|---|
| Open | Fonnesbeck Gary O | $57,500 | |
| Open | Fonnesbeck Gary | $100,000 | |
| Previous Owner | Franek Robert A | $184,500 |
Source: Public Records
Tax History Compared to Growth
Tax History
| Year | Tax Paid | Tax Assessment Tax Assessment Total Assessment is a certain percentage of the fair market value that is determined by local assessors to be the total taxable value of land and additions on the property. | Land | Improvement |
|---|---|---|---|---|
| 2025 | $4,573 | $396,533 | $320,472 | $76,061 |
| 2024 | $4,573 | $388,758 | $314,188 | $74,570 |
| 2023 | $4,466 | $381,136 | $308,028 | $73,108 |
| 2022 | $4,397 | $373,663 | $301,988 | $71,675 |
| 2021 | $4,316 | $366,337 | $296,067 | $70,270 |
| 2020 | $4,267 | $362,581 | $293,031 | $69,550 |
| 2019 | $4,195 | $355,472 | $287,285 | $68,187 |
| 2018 | $4,101 | $348,502 | $281,652 | $66,850 |
| 2017 | $4,034 | $341,669 | $276,129 | $65,540 |
| 2016 | $3,872 | $334,970 | $270,715 | $64,255 |
| 2015 | $3,812 | $329,939 | $266,649 | $63,290 |
| 2014 | $3,736 | $323,476 | $261,425 | $62,051 |
Source: Public Records
Map
Nearby Homes
- 16722 Goldenwest St
- 16892 Limelight Cir Unit B
- 16531 Sabot Ln
- 7002 Valentine Dr
- 16542 Sabot Ln
- 6672 Sun Dr Unit B
- 16401 Serenade Ln
- 16381 Magellan Ln
- 7248 Aura Cir
- 7252 Ellington Dr
- 7231 Alchemy Cir
- 7223 Alchemy Cir
- 7264 Aura Cir
- 7272 Ellington Dr
- 7252 Elk Cir
- 6600 Warner Ave Unit 50
- 6600 Warner Ave
- 6351 Gloria Dr
- 6292 Heil Ave
- 16081 Windemeir Ln
- 16642 Simmone Ln
- 16662 Simmone Ln
- 16651 Kettler Ln
- 16641 Kettler Ln
- 16661 Kettler Ln
- 16632 Simmone Ln
- 16672 Simmone Ln
- 16631 Kettler Ln
- 16671 Kettler Ln
- 16651 Simmone Ln
- 16641 Simonne Ln
- 16641 Simmone Ln
- 16622 Simonne Ln
- 16622 Simmone Ln
- 16661 Simmone Ln
- 16622 Simone Ln
- 16682 Simmone Ln
- 16631 Simmone Ln
- 16631 Simonne Ln
- 16621 Kettler Ln