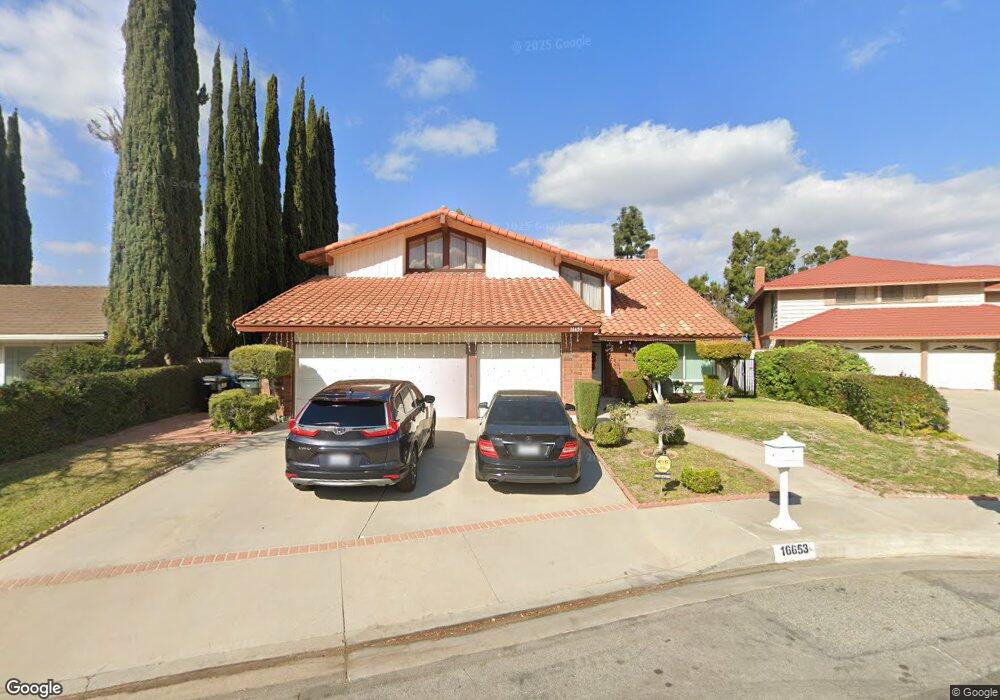
16653 Echo Hill Way Hacienda Heights, CA 91745
Estimated Value: $1,012,000 - $1,201,000
4
Beds
3
Baths
2,470
Sq Ft
$458/Sq Ft
Est. Value
About This Home
This home is located at 16653 Echo Hill Way, Hacienda Heights, CA 91745 and is currently estimated at $1,131,748, approximately $458 per square foot. 16653 Echo Hill Way is a home located in Los Angeles County with nearby schools including Grazide Elementary School, Mesa Robles School, and Glen A. Wilson High School.
Ownership History
Date
Name
Owned For
Owner Type
Purchase Details
Closed on
Apr 3, 2020
Sold by
Hu Li Hua Liu
Bought by
Hu Li Hua Liu and Hu Chih Lung
Current Estimated Value
Purchase Details
Closed on
Jan 23, 2020
Sold by
Hu Tsai Hua
Bought by
Hu Li Hua Liu
Home Financials for this Owner
Home Financials are based on the most recent Mortgage that was taken out on this home.
Original Mortgage
$480,000
Outstanding Balance
$422,442
Interest Rate
3.4%
Mortgage Type
Credit Line Revolving
Estimated Equity
$709,306
Purchase Details
Closed on
Mar 5, 1999
Sold by
Wang Frank W
Bought by
Hu Tsai Hua and Hu Li Hua Liu
Purchase Details
Closed on
Jun 13, 1996
Sold by
Wang Frank Wei Tsung
Bought by
Wang Frank Wei Tsung
Home Financials for this Owner
Home Financials are based on the most recent Mortgage that was taken out on this home.
Original Mortgage
$203,000
Interest Rate
8.25%
Create a Home Valuation Report for This Property
The Home Valuation Report is an in-depth analysis detailing your home's value as well as a comparison with similar homes in the area
Home Values in the Area
Average Home Value in this Area
Purchase History
| Date | Buyer | Sale Price | Title Company |
|---|---|---|---|
| Hu Li Hua Liu | -- | Chicago Title | |
| Hu Li Hua Liu | -- | Chicago Title | |
| Hu Tsai Hua | $338,000 | Chicago Title | |
| Wang Frank Wei Tsung | -- | Provident Title Company |
Source: Public Records
Mortgage History
| Date | Status | Borrower | Loan Amount |
|---|---|---|---|
| Open | Hu Li Hua Liu | $480,000 | |
| Previous Owner | Wang Frank Wei Tsung | $203,000 |
Source: Public Records
Tax History Compared to Growth
Tax History
| Year | Tax Paid | Tax Assessment Tax Assessment Total Assessment is a certain percentage of the fair market value that is determined by local assessors to be the total taxable value of land and additions on the property. | Land | Improvement |
|---|---|---|---|---|
| 2025 | $6,717 | $529,861 | $169,612 | $360,249 |
| 2024 | $6,717 | $519,473 | $166,287 | $353,186 |
| 2023 | $6,552 | $509,288 | $163,027 | $346,261 |
| 2022 | $6,359 | $499,303 | $159,831 | $339,472 |
| 2021 | $6,238 | $489,514 | $156,698 | $332,816 |
| 2020 | $6,156 | $484,496 | $155,092 | $329,404 |
| 2019 | $6,057 | $474,997 | $152,051 | $322,946 |
| 2018 | $5,841 | $465,684 | $149,070 | $316,614 |
| 2016 | $5,398 | $447,603 | $143,283 | $304,320 |
| 2015 | $5,302 | $440,880 | $141,131 | $299,749 |
| 2014 | $5,217 | $432,245 | $138,367 | $293,878 |
Source: Public Records
Map
Nearby Homes
- 16647 Echo Hill Way
- 2367 Mountain Brook Dr
- 2521 Mountainview Ct
- 16495 Canelones Dr
- 2122 Marblecrest Dr
- 2075 Country Canyon Rd
- 16390 Gregorio Dr
- 2021 Elderway Dr
- 1610 Coach Place
- 1804 Ewing Ct
- 1831 Ewing Ct Unit 32
- 16500 Ember Glen Rd
- 2082 Salto Dr
- 16311 Sierra Trail Ct
- 17062 Colima Rd Unit 251
- 17078 Colima Rd Unit 323
- 17070 Colima Rd Unit 284
- 17068 Colima Rd Unit 274
- 1740 Rada Rd
- 17050 Colima Rd Unit 199
- 16655 Echo Hill Way
- 16639 Echo Hill Way
- 16659 Echo Hill Way
- 16658 Circle Hill Ln
- 16652 Circle Hill Ln
- 16658 Echo Hill Way
- 16672 Circle Hill Ln
- 16631 Echo Hill Way
- 16646 Echo Hill Way
- 16652 Echo Hill Way
- 16664 Circle Hill Ln
- 16644 Circle Hill Ln
- 16640 Echo Hill Way
- 16654 Echo Hill Way
- 16625 Echo Hill Way
- 16636 Echo Hill Way
- 16638 Circle Hill Ln
- 2298 Oldridge Dr
- 16628 Echo Hill Way
- 16715 Dawn Haven Rd