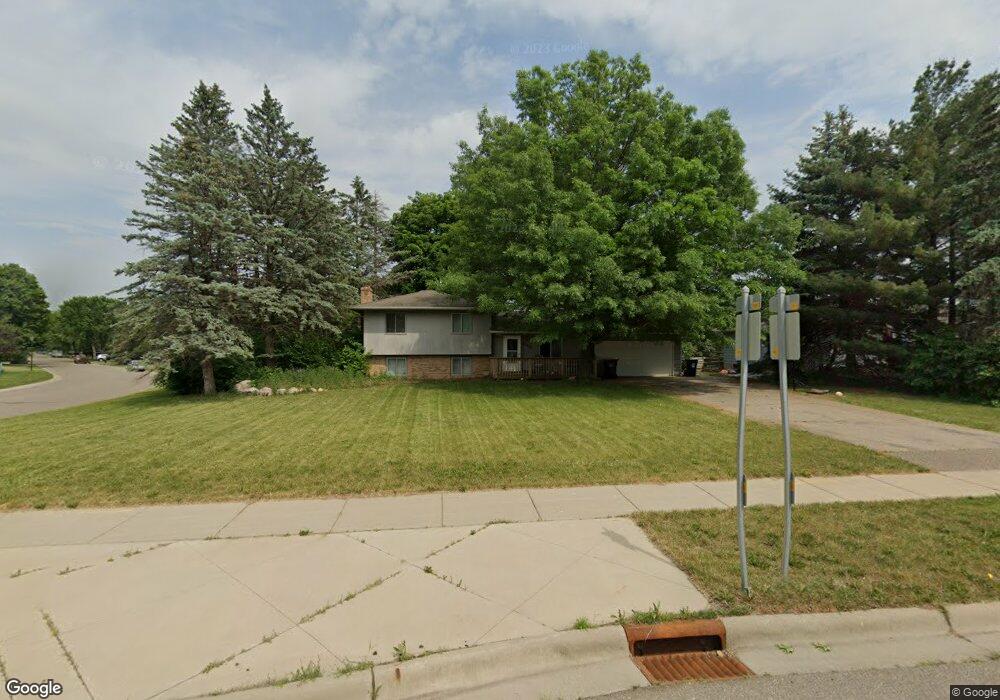
16656 Flagstaff Ave W Rosemount, MN 55068
Estimated Value: $322,000 - $357,000
3
Beds
2
Baths
1,007
Sq Ft
$343/Sq Ft
Est. Value
About This Home
This home is located at 16656 Flagstaff Ave W, Rosemount, MN 55068 and is currently estimated at $345,887, approximately $343 per square foot. 16656 Flagstaff Ave W is a home located in Dakota County with nearby schools including Parkview Elementary School, Scott Highlands Middle School, and Rosemount Senior High School.
Ownership History
Date
Name
Owned For
Owner Type
Purchase Details
Closed on
Feb 22, 2016
Sold by
Us Bank Trust Na
Bought by
Krueger Ryan J and Krueger Britnie L
Current Estimated Value
Home Financials for this Owner
Home Financials are based on the most recent Mortgage that was taken out on this home.
Original Mortgage
$186,105
Outstanding Balance
$146,898
Interest Rate
3.65%
Mortgage Type
New Conventional
Estimated Equity
$198,989
Purchase Details
Closed on
Nov 21, 2003
Sold by
Fladhammer Christopher S and Fladhammer Sarah A
Bought by
Bank Of America Na
Purchase Details
Closed on
Jul 31, 2000
Sold by
Estate Of Jonathan D Goldberg
Bought by
Fladhammer Christopher S and Fladhammer Sarah A
Purchase Details
Closed on
Jul 30, 1999
Sold by
Chaika Gary A and Chaika Audrey M
Bought by
Goldberg Jonathan D
Create a Home Valuation Report for This Property
The Home Valuation Report is an in-depth analysis detailing your home's value as well as a comparison with similar homes in the area
Home Values in the Area
Average Home Value in this Area
Purchase History
| Date | Buyer | Sale Price | Title Company |
|---|---|---|---|
| Krueger Ryan J | $195,900 | First American Title Ins Co | |
| Us Bank Trust Na | -- | First American Title Ins Co | |
| Bank Of America Na | $177,138 | None Available | |
| Fladhammer Christopher S | $155,000 | -- | |
| Goldberg Jonathan D | $130,000 | -- |
Source: Public Records
Mortgage History
| Date | Status | Borrower | Loan Amount |
|---|---|---|---|
| Open | Krueger Ryan J | $186,105 |
Source: Public Records
Tax History Compared to Growth
Tax History
| Year | Tax Paid | Tax Assessment Tax Assessment Total Assessment is a certain percentage of the fair market value that is determined by local assessors to be the total taxable value of land and additions on the property. | Land | Improvement |
|---|---|---|---|---|
| 2024 | $3,472 | $309,000 | $68,900 | $240,100 |
| 2023 | $3,472 | $310,600 | $68,700 | $241,900 |
| 2022 | $2,988 | $300,100 | $68,400 | $231,700 |
| 2021 | $2,832 | $257,400 | $59,500 | $197,900 |
| 2020 | $2,820 | $235,500 | $56,700 | $178,800 |
| 2019 | $2,561 | $227,700 | $51,000 | $176,700 |
| 2018 | $2,397 | $215,500 | $48,500 | $167,000 |
| 2017 | $2,369 | $196,200 | $46,200 | $150,000 |
| 2016 | $2,265 | $185,500 | $44,000 | $141,500 |
| 2015 | $2,187 | $152,638 | $37,415 | $115,223 |
| 2014 | -- | $147,406 | $36,199 | $111,207 |
| 2013 | -- | $133,236 | $32,457 | $100,779 |
Source: Public Records
Map
Nearby Homes
- 16563 Fishing Ave W
- 6649 167th St W
- 6678 166th St W
- 16546 Foliage Ave W
- 6656 Gerdine Path W
- 17126 Firtree Place
- 6634 162nd Ct Unit 421
- 16123 Flagstaff Ct N
- 16660 Garland Way W
- 6744 Foliage Ct W
- 7130 167th Ct W
- 6882 173rd St W
- 6852 161st St W
- 17415 Fireside Ln
- 6414 158th St W Unit 201
- 15973 Flotilla Trail Unit 300
- 15792 Flan Ct
- 6760 158th St W
- 17583 Foxboro Ln
- 15767 Finch Ave
- 16660 Flagstaff Way W
- 16702 Flagstaff Ave W
- 16702 16702 Flagstaff Ave W
- 16634 Flagstaff Ave W
- 16650 Flagstaff Way W
- 16645 Flagstaff Ave W
- 16655 Flagstaff Ave W
- 16635 Flagstaff Ave W
- 16640 Flagstaff Way W
- 16616 Flagstaff Ave W
- 16701 Flagstaff Ave W
- 16653 Flagstaff Way W
- 16625 Flagstaff Ave W
- 16715 Flagstaff Ave W
- 16630 Flagstaff Way W
- 16711 Firestone Ct
- 16608 Flagstaff Ave W
- 16615 Flagstaff Ave W
- 16608 16608 Flagstaff Ave W
- 16717 Firestone Ct