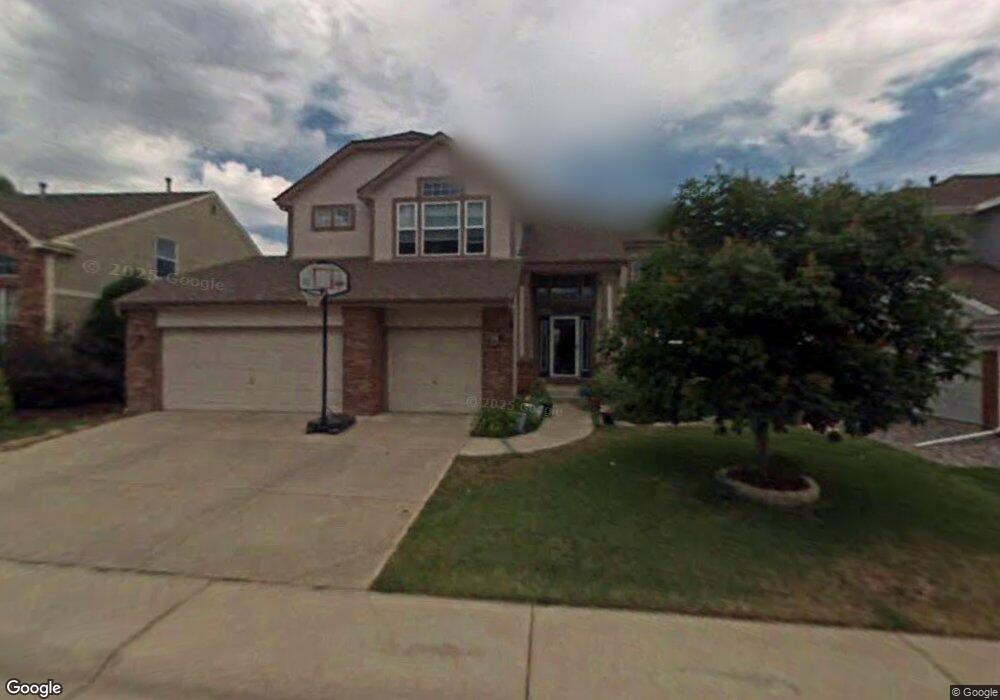
1667 Mountain Maple Ave Highlands Ranch, CO 80129
Westridge NeighborhoodEstimated Value: $811,018 - $901,000
4
Beds
4
Baths
3,801
Sq Ft
$223/Sq Ft
Est. Value
About This Home
This home is located at 1667 Mountain Maple Ave, Highlands Ranch, CO 80129 and is currently estimated at $849,005, approximately $223 per square foot. 1667 Mountain Maple Ave is a home located in Douglas County with nearby schools including Coyote Creek Elementary School, Ranch View Middle School, and Thunderridge High School.
Ownership History
Date
Name
Owned For
Owner Type
Purchase Details
Closed on
Nov 9, 2016
Sold by
Jordan Linda L
Bought by
Spilman Ryan Michael and Spilman Kimberly A
Current Estimated Value
Home Financials for this Owner
Home Financials are based on the most recent Mortgage that was taken out on this home.
Original Mortgage
$388,000
Outstanding Balance
$308,978
Interest Rate
3.42%
Mortgage Type
New Conventional
Estimated Equity
$540,027
Purchase Details
Closed on
Jun 26, 1995
Sold by
High View Homes Llc
Bought by
Jordan Linda L
Home Financials for this Owner
Home Financials are based on the most recent Mortgage that was taken out on this home.
Original Mortgage
$122,000
Interest Rate
7.77%
Purchase Details
Closed on
Dec 12, 1994
Sold by
Mission Viejo Co
Bought by
High View Homes
Create a Home Valuation Report for This Property
The Home Valuation Report is an in-depth analysis detailing your home's value as well as a comparison with similar homes in the area
Home Values in the Area
Average Home Value in this Area
Purchase History
| Date | Buyer | Sale Price | Title Company |
|---|---|---|---|
| Spilman Ryan Michael | $485,000 | Stewart Title | |
| Jordan Linda L | $187,350 | Land Title | |
| High View Homes | $60,500 | -- |
Source: Public Records
Mortgage History
| Date | Status | Borrower | Loan Amount |
|---|---|---|---|
| Open | Spilman Ryan Michael | $388,000 | |
| Previous Owner | Jordan Linda L | $122,000 |
Source: Public Records
Tax History
| Year | Tax Paid | Tax Assessment Tax Assessment Total Assessment is a certain percentage of the fair market value that is determined by local assessors to be the total taxable value of land and additions on the property. | Land | Improvement |
|---|---|---|---|---|
| 2025 | $5,064 | $52,330 | $11,000 | $41,330 |
| 2024 | $5,064 | $57,420 | $12,640 | $44,780 |
| 2023 | $5,055 | $57,420 | $12,640 | $44,780 |
| 2022 | $3,803 | $41,630 | $9,200 | $32,430 |
| 2021 | $3,955 | $41,630 | $9,200 | $32,430 |
| 2020 | $3,781 | $40,770 | $8,420 | $32,350 |
| 2019 | $3,795 | $40,770 | $8,420 | $32,350 |
| 2018 | $3,369 | $35,650 | $8,080 | $27,570 |
| 2017 | $3,068 | $35,650 | $8,080 | $27,570 |
| 2016 | $3,003 | $34,250 | $7,890 | $26,360 |
| 2015 | $3,068 | $34,250 | $7,890 | $26,360 |
| 2014 | -- | $29,340 | $6,210 | $23,130 |
Source: Public Records
Map
Nearby Homes
- 1721 Mountain Maple Ave
- 1993 Mountain Maple Ave
- 10473 Grizzly Gulch
- 2332 Hyacinth Rd
- 2266 Ashwood Place
- 10578 Hyacinth Ln
- 10672 Hyacinth St
- 10505 Hyacinth Place
- 978 Sage Sparrow Cir
- 2627 Baneberry Ln
- 1086 Thornbury Place
- 9809 Mulberry Way
- 2146 Castle Ridge Way
- 1135 Riddlewood Ln
- 2964 White Oak St
- 10275 Baneberry Place
- 907 Riddlewood Ln
- 10060 Royal Eagle Ln
- 9664 Whitecliff Place
- 1294 Braewood Ave
- 1653 Mountain Maple Ave
- 1681 Mountain Maple Ave
- 1672 Spring Water Place
- 1686 Spring Water Place
- 1637 Mountain Maple Ave
- 1658 Spring Water Place
- 1695 Mountain Maple Ave
- 1704 Spring Water Place
- 1668 Mountain Maple Ave
- 1644 Spring Water Place
- 1654 Mountain Maple Ave
- 1625 Mountain Maple Ave
- 1709 Mountain Maple Ave
- 1716 Spring Water Place
- 1640 Mountain Maple Ave
- 1696 Mountain Maple Ave
- 1730 Spring Water Place
- 1626 Mountain Maple Ave
- 1604 Spring Water Ln
- 1611 Mountain Maple Ave