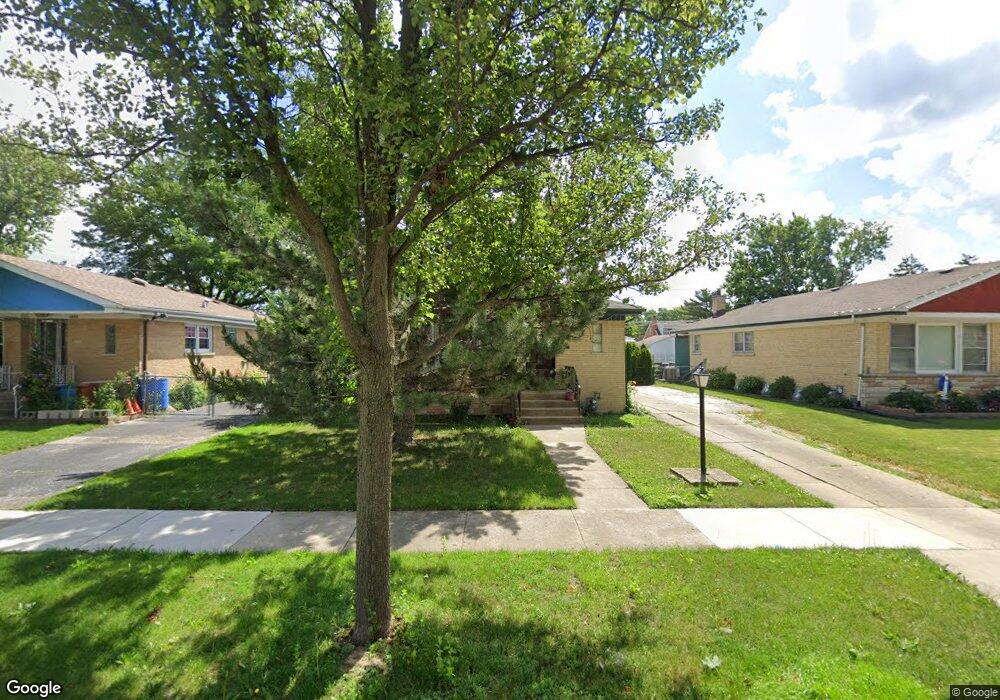
1667 Orchard St Des Plaines, IL 60018
Estimated Value: $303,000 - $381,000
3
Beds
1
Bath
1,076
Sq Ft
$328/Sq Ft
Est. Value
About This Home
This home is located at 1667 Orchard St, Des Plaines, IL 60018 and is currently estimated at $353,028, approximately $328 per square foot. 1667 Orchard St is a home located in Cook County with nearby schools including South Elementary School, Algonquin Middle School, and Maine West High School.
Ownership History
Date
Name
Owned For
Owner Type
Purchase Details
Closed on
Sep 24, 2020
Sold by
Labay Edwardine and The Edwardine Labay Trust
Bought by
Paterakos Alexander and Sanchez Maria G
Current Estimated Value
Home Financials for this Owner
Home Financials are based on the most recent Mortgage that was taken out on this home.
Original Mortgage
$248,270
Interest Rate
3%
Mortgage Type
FHA
Purchase Details
Closed on
Oct 23, 2015
Sold by
Labay Edwardine
Bought by
Labay Edwardine and The Edwardine Labay Trust
Purchase Details
Closed on
Jan 10, 2003
Sold by
Niemaszyk Richard
Bought by
Labay Edwardine
Home Financials for this Owner
Home Financials are based on the most recent Mortgage that was taken out on this home.
Original Mortgage
$196,800
Interest Rate
6.3%
Purchase Details
Closed on
Sep 27, 2001
Sold by
Niemaszyk Marion R
Bought by
Niemaszyk Marion R and The Marion Niemaszyk Trust
Create a Home Valuation Report for This Property
The Home Valuation Report is an in-depth analysis detailing your home's value as well as a comparison with similar homes in the area
Home Values in the Area
Average Home Value in this Area
Purchase History
| Date | Buyer | Sale Price | Title Company |
|---|---|---|---|
| Paterakos Alexander | $269,000 | Stewart Title | |
| Labay Edwardine | -- | Attorney | |
| Labay Edwardine | $246,000 | Golden Title | |
| Niemaszyk Marion R | -- | -- |
Source: Public Records
Mortgage History
| Date | Status | Borrower | Loan Amount |
|---|---|---|---|
| Previous Owner | Paterakos Alexander | $248,270 | |
| Previous Owner | Labay Edwardine | $196,800 |
Source: Public Records
Tax History Compared to Growth
Tax History
| Year | Tax Paid | Tax Assessment Tax Assessment Total Assessment is a certain percentage of the fair market value that is determined by local assessors to be the total taxable value of land and additions on the property. | Land | Improvement |
|---|---|---|---|---|
| 2024 | $4,318 | $16,381 | $2,363 | $14,018 |
| 2023 | $4,215 | $16,381 | $2,363 | $14,018 |
| 2022 | $4,215 | $16,381 | $2,363 | $14,018 |
| 2021 | $3,086 | $10,040 | $1,968 | $8,072 |
| 2020 | $1,628 | $10,040 | $1,968 | $8,072 |
| 2019 | $1,638 | $11,403 | $1,968 | $9,435 |
| 2018 | $169 | $12,493 | $1,732 | $10,761 |
| 2017 | $2,927 | $12,493 | $1,732 | $10,761 |
| 2016 | $2,951 | $12,493 | $1,732 | $10,761 |
| 2015 | $3,091 | $12,192 | $1,496 | $10,696 |
| 2014 | $3,038 | $12,192 | $1,496 | $10,696 |
| 2013 | $2,949 | $12,192 | $1,496 | $10,696 |
Source: Public Records
Map
Nearby Homes
- 1721 Linden St
- 1536 Orchard St
- 1640 S River Rd
- 1928 Kennicott Ct
- 1724 Illinois St
- 1689 S Elm St
- 1632 S Elm St
- 1700 E Forest Ave
- 1278 E River Dr
- 1489 E Algonquin Rd
- 2017 Pine St Unit B
- 1783 Lee St
- 2015 Busse Hwy
- 960 S River Rd Unit 410
- 960 S River Rd Unit 208
- 1524 Oakwood Ave
- 991 Wicke Ave
- 1706 Buckingham Dr
- 1641 E Touhy Ave
- 1629 E Touhy Ave
- 1667 Orchard St
- 1659 Orchard St
- 1675 Orchard St
- 1675 Orchard St
- 1651 Orchard St
- 1651 Orchard St
- 1685 Orchard St
- 1643 Orchard St
- 1668 Sycamore St
- 1660 Sycamore St
- 1660 Sycamore St
- 1676 Sycamore St
- 1666 Orchard St
- 1658 Orchard St
- 1674 Orchard St
- 1654 Sycamore St
- 1686 Sycamore St
- 1693 Orchard St
- 1693 Orchard St
- 1635 Orchard St