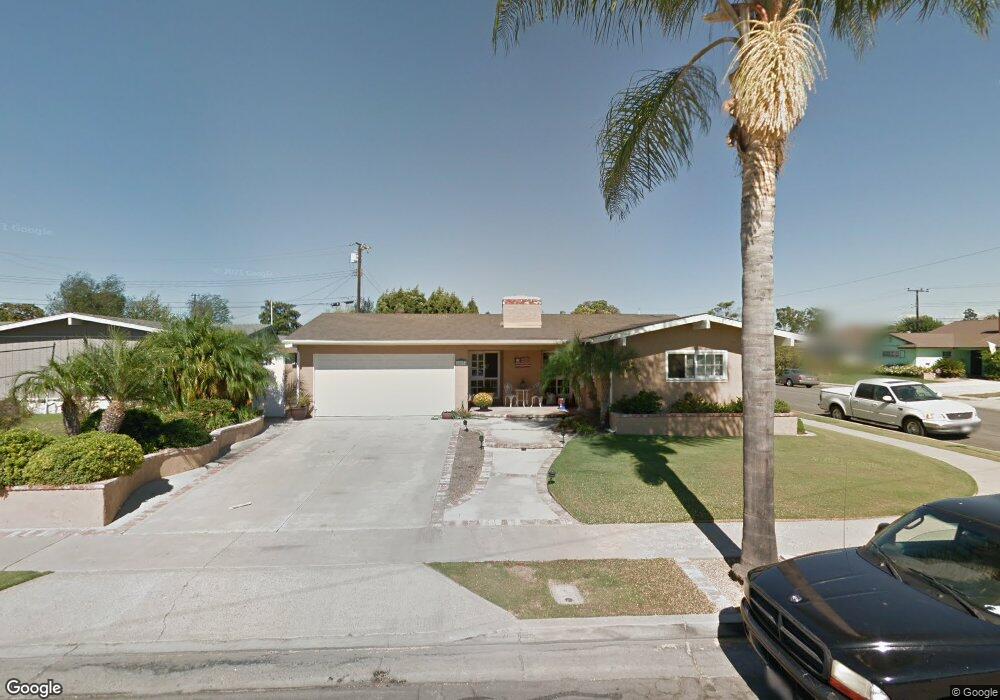
16671 Nile Cir Huntington Beach, CA 92647
Estimated Value: $1,283,000 - $1,335,000
4
Beds
2
Baths
1,858
Sq Ft
$701/Sq Ft
Est. Value
About This Home
This home is located at 16671 Nile Cir, Huntington Beach, CA 92647 and is currently estimated at $1,302,206, approximately $700 per square foot. 16671 Nile Cir is a home located in Orange County with nearby schools including Sun View Elementary School, Spring View Middle School, and Ocean View High.
Ownership History
Date
Name
Owned For
Owner Type
Purchase Details
Closed on
Jan 29, 2020
Sold by
Folga Sharon A and The Folga Family Trust
Bought by
Folga Sharon A and The Folga Family Trust
Current Estimated Value
Home Financials for this Owner
Home Financials are based on the most recent Mortgage that was taken out on this home.
Original Mortgage
$100,000
Outstanding Balance
$88,777
Interest Rate
3.74%
Mortgage Type
Credit Line Revolving
Estimated Equity
$1,213,429
Purchase Details
Closed on
Apr 16, 2003
Sold by
Folga Thomas J and Folga Sharon A
Bought by
Folga Thomas J and Folga Sharon A
Home Financials for this Owner
Home Financials are based on the most recent Mortgage that was taken out on this home.
Original Mortgage
$110,000
Interest Rate
5.72%
Purchase Details
Closed on
Aug 30, 1993
Sold by
Folga Thomas J and Folga Sharon A
Bought by
Folga Thomas J and Folga Sharon A
Create a Home Valuation Report for This Property
The Home Valuation Report is an in-depth analysis detailing your home's value as well as a comparison with similar homes in the area
Home Values in the Area
Average Home Value in this Area
Purchase History
| Date | Buyer | Sale Price | Title Company |
|---|---|---|---|
| Folga Sharon A | -- | First American Title Ins Co | |
| Folga Thomas J | -- | Equity Title | |
| Folga Thomas J | -- | Equity Title | |
| Folga Thomas J | -- | -- |
Source: Public Records
Mortgage History
| Date | Status | Borrower | Loan Amount |
|---|---|---|---|
| Open | Folga Sharon A | $100,000 | |
| Closed | Folga Thomas J | $110,000 |
Source: Public Records
Tax History Compared to Growth
Tax History
| Year | Tax Paid | Tax Assessment Tax Assessment Total Assessment is a certain percentage of the fair market value that is determined by local assessors to be the total taxable value of land and additions on the property. | Land | Improvement |
|---|---|---|---|---|
| 2025 | $1,576 | $117,479 | $30,517 | $86,962 |
| 2024 | $1,576 | $115,176 | $29,919 | $85,257 |
| 2023 | $1,536 | $112,918 | $29,332 | $83,586 |
| 2022 | $1,507 | $110,704 | $28,756 | $81,948 |
| 2021 | $1,480 | $108,534 | $28,192 | $80,342 |
| 2020 | $1,540 | $107,422 | $27,903 | $79,519 |
| 2019 | $1,518 | $105,316 | $27,356 | $77,960 |
| 2018 | $1,487 | $103,251 | $26,819 | $76,432 |
| 2017 | $1,464 | $101,227 | $26,293 | $74,934 |
| 2016 | $1,413 | $99,243 | $25,778 | $73,465 |
| 2015 | $1,391 | $97,753 | $25,391 | $72,362 |
| 2014 | $1,363 | $95,839 | $24,894 | $70,945 |
Source: Public Records
Map
Nearby Homes
- 16637 Viewpoint Ln Unit 12D
- 7901 Rhine Dr
- 16962 Westwood Ln Unit 14
- 17091 Oak Ln
- 16782 Heritage Ln
- 7252 Elk Cir
- 16781 Scotsdale Cir
- 16542 Sabot Ln
- 16381 Magellan Ln
- 16531 Sabot Ln
- 16401 Serenade Ln
- 16722 Goldenwest St
- 17261 Gothard St Unit 50
- 17261 Gothard St Unit 67
- 17261 Gothard St Unit 63
- 17261 Gothard St Unit 64
- 16761 Irby Ln
- 17412 Dairyview Cir
- 7002 Valentine Dr
- 16102 Malaga Ln