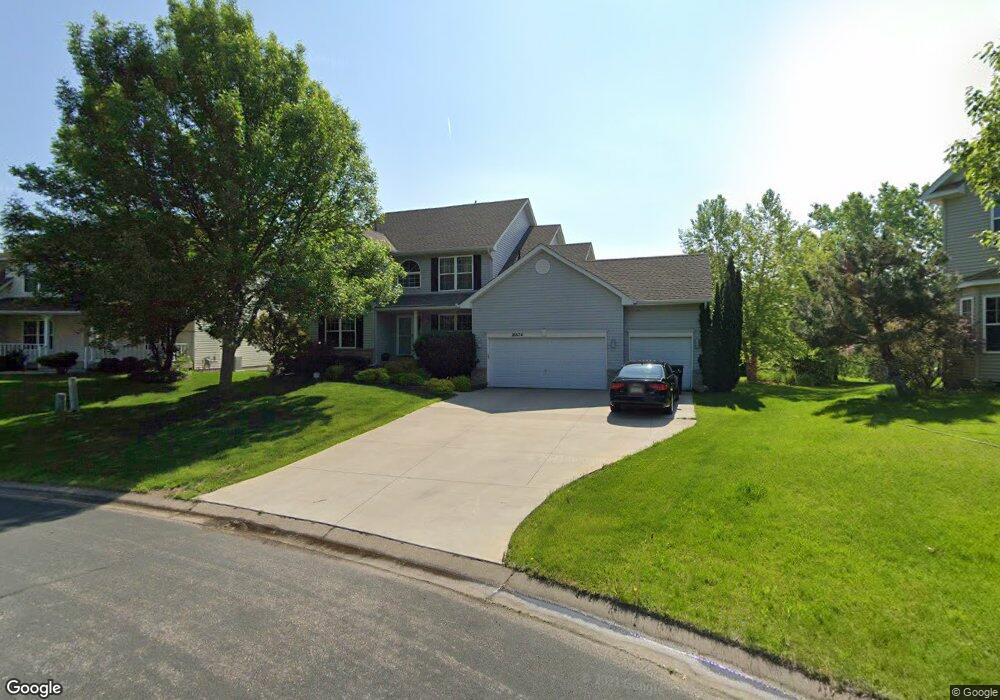
16674 Farrago Trail Farmington, MN 55024
Estimated Value: $556,000 - $562,646
4
Beds
4
Baths
2,318
Sq Ft
$242/Sq Ft
Est. Value
About This Home
This home is located at 16674 Farrago Trail, Farmington, MN 55024 and is currently estimated at $560,162, approximately $241 per square foot. 16674 Farrago Trail is a home located in Dakota County with nearby schools including Parkview Elementary School, Scott Highlands Middle School, and Rosemount Senior High School.
Ownership History
Date
Name
Owned For
Owner Type
Purchase Details
Closed on
Sep 22, 2017
Sold by
Smith Mark J and Smith Shannon M
Bought by
Sua Frederik
Current Estimated Value
Home Financials for this Owner
Home Financials are based on the most recent Mortgage that was taken out on this home.
Original Mortgage
$351,405
Outstanding Balance
$293,132
Interest Rate
3.86%
Mortgage Type
New Conventional
Estimated Equity
$267,030
Purchase Details
Closed on
Dec 4, 2015
Sold by
Baker Bryan and Baker Sarah
Bought by
Smith Mark J and Smith Shannon M
Home Financials for this Owner
Home Financials are based on the most recent Mortgage that was taken out on this home.
Original Mortgage
$324,022
Interest Rate
3.75%
Mortgage Type
FHA
Purchase Details
Closed on
Jun 4, 2010
Sold by
Thompson Gregory K and Thompson Susan L
Bought by
Baker Bryan and Baker Sarah
Purchase Details
Closed on
May 7, 2002
Sold by
D R Horton Inc - Minnesota
Bought by
Thompson Gregory K and Elliot Susan L
Create a Home Valuation Report for This Property
The Home Valuation Report is an in-depth analysis detailing your home's value as well as a comparison with similar homes in the area
Home Values in the Area
Average Home Value in this Area
Purchase History
| Date | Buyer | Sale Price | Title Company |
|---|---|---|---|
| Sua Frederik | $369,900 | Burnet Title | |
| Smith Mark J | $330,000 | Burnet Title | |
| Baker Bryan | $299,000 | -- | |
| Thompson Gregory K | $284,534 | -- |
Source: Public Records
Mortgage History
| Date | Status | Borrower | Loan Amount |
|---|---|---|---|
| Open | Sua Frederik | $351,405 | |
| Previous Owner | Smith Mark J | $324,022 |
Source: Public Records
Tax History Compared to Growth
Tax History
| Year | Tax Paid | Tax Assessment Tax Assessment Total Assessment is a certain percentage of the fair market value that is determined by local assessors to be the total taxable value of land and additions on the property. | Land | Improvement |
|---|---|---|---|---|
| 2024 | $5,638 | $522,200 | $96,000 | $426,200 |
| 2023 | $5,638 | $529,100 | $95,700 | $433,400 |
| 2022 | $4,612 | $502,100 | $95,400 | $406,700 |
| 2021 | $4,442 | $421,200 | $83,000 | $338,200 |
| 2020 | $4,488 | $392,200 | $79,000 | $313,200 |
| 2019 | $4,098 | $385,400 | $75,300 | $310,100 |
| 2018 | $3,959 | $369,000 | $71,700 | $297,300 |
| 2017 | $4,148 | $347,700 | $68,200 | $279,500 |
| 2016 | $3,965 | $335,100 | $65,000 | $270,100 |
| 2015 | $3,837 | $318,972 | $61,589 | $257,383 |
| 2014 | -- | $311,778 | $59,688 | $252,090 |
| 2013 | -- | $288,016 | $54,244 | $233,772 |
Source: Public Records
Map
Nearby Homes
- 16563 Fishing Ave W
- 17126 Firtree Place
- 16793 Embers Ave Unit 606
- 16809 Embers Ave Unit 702
- 16895 Embers Ave
- 16770 Embers Ave
- 16424 Elm Creek Ln Unit 4029
- 16915 Embers Ave Unit 1204
- 16413 Envoy Way
- 17415 Fireside Ln
- 6649 167th St W
- 17207 Encina Path
- 17373 N Creek Dr
- 6678 166th St W
- 5387 172nd St W Unit 2006
- 5377 172nd St W Unit 2002
- 6656 Gerdine Path W
- 16546 Foliage Ave W
- 6634 162nd Ct Unit 421
- 16123 Flagstaff Ct N
- 16674 16674 Farrago Trail
- 16666 Farrago Trail
- 16680 Farrago Trail
- 16680 Farrago Trail
- 16683 16683 Farrago Trail
- 16648 Farrago Trail
- 16686 Farrago Trail
- 16683 Farrago Trail
- 16696 Farrago Trail
- 16647 Farrago Trail
- 16699 Farrago Trail
- 16638 Farrago Trail
- 16638 Farrago Trail
- 6119 169th St W
- 6123 169th St W
- 6137 169th St W
- 6137 169th St W
- 16799 Fairhill Ct
- 16637 16637 Farrago-Trail-
- 16637 Farrago Trail