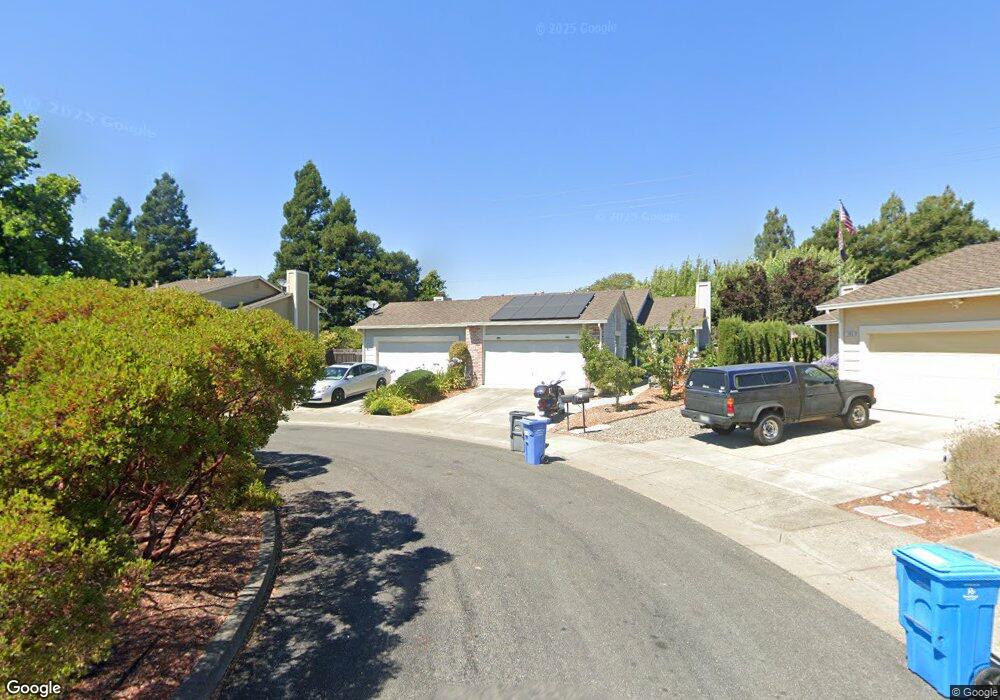
1668 Northstar Ct Petaluma, CA 94954
College Heights NeighborhoodEstimated Value: $622,000 - $737,000
3
Beds
2
Baths
1,116
Sq Ft
$600/Sq Ft
Est. Value
About This Home
This home is located at 1668 Northstar Ct, Petaluma, CA 94954 and is currently estimated at $670,117, approximately $600 per square foot. 1668 Northstar Ct is a home located in Sonoma County with nearby schools including Kenilworth Junior High School, Casa Grande High School, and Sonoma Mountain Elementary School.
Ownership History
Date
Name
Owned For
Owner Type
Purchase Details
Closed on
May 30, 2017
Sold by
Nau Marshall R
Bought by
Nau Marshall R and Nau Melanie A
Current Estimated Value
Home Financials for this Owner
Home Financials are based on the most recent Mortgage that was taken out on this home.
Original Mortgage
$320,000
Outstanding Balance
$265,808
Interest Rate
3.97%
Mortgage Type
New Conventional
Estimated Equity
$404,309
Purchase Details
Closed on
Jul 3, 2008
Sold by
Ocana Shelly and Estate Of Jack Raymond Nau
Bought by
Nau Marshall R
Home Financials for this Owner
Home Financials are based on the most recent Mortgage that was taken out on this home.
Original Mortgage
$287,000
Interest Rate
6.31%
Mortgage Type
Purchase Money Mortgage
Purchase Details
Closed on
Jul 2, 2002
Sold by
Crawford Robert and Brians Sandy
Bought by
Nau Jack R
Home Financials for this Owner
Home Financials are based on the most recent Mortgage that was taken out on this home.
Original Mortgage
$260,000
Interest Rate
6.78%
Create a Home Valuation Report for This Property
The Home Valuation Report is an in-depth analysis detailing your home's value as well as a comparison with similar homes in the area
Home Values in the Area
Average Home Value in this Area
Purchase History
We collect this data history from publicly available records. To have your information removed, we recommend requesting removal directly through your county’s website.
| Date | Buyer | Sale Price | Title Company |
|---|---|---|---|
| Nau Marshall R | -- | First American Title Company | |
| Nau Marshall R | $356,000 | First American Title Co | |
| Nau Jack R | $325,000 | Old Republic Title Company | |
| Nau Jack R | -- | Old Republic Title Company |
Source: Public Records
Mortgage History
We collect this data history from publicly available records. To have your information removed, we recommend requesting removal directly through your county’s website.
| Date | Status | Borrower | Loan Amount |
|---|---|---|---|
| Open | Nau Marshall R | $320,000 | |
| Closed | Nau Marshall R | $287,000 | |
| Previous Owner | Nau Jack R | $260,000 |
Source: Public Records
Tax History
| Year | Tax Paid | Tax Assessment Tax Assessment Total Assessment is a certain percentage of the fair market value that is determined by local assessors to be the total taxable value of land and additions on the property. | Land | Improvement |
|---|---|---|---|---|
| 2025 | $5,402 | $470,699 | $275,181 | $195,518 |
| 2024 | $5,173 | $461,471 | $269,786 | $191,685 |
| 2023 | $5,173 | $452,424 | $264,497 | $187,927 |
| 2022 | $5,055 | $443,554 | $259,311 | $184,243 |
| 2021 | $4,997 | $434,858 | $254,227 | $180,631 |
| 2020 | $5,032 | $430,400 | $251,621 | $178,779 |
| 2019 | $4,981 | $421,962 | $246,688 | $175,274 |
| 2018 | $4,837 | $413,689 | $241,851 | $171,838 |
| 2017 | $4,767 | $405,578 | $237,109 | $168,469 |
| 2016 | $4,619 | $397,626 | $232,460 | $165,166 |
| 2015 | $4,499 | $391,655 | $228,969 | $162,686 |
| 2014 | $3,757 | $323,000 | $189,000 | $134,000 |
Source: Public Records
Map
Nearby Homes
- 1997 Rainier Cir
- 519 Danby Ct
- 520 Almanor St
- 116 Banff Way
- 148 Oakwood Dr
- 719 Riesling Ct
- 130 Candlewood Dr
- 97 Candlewood Dr
- 571 Birchwood Dr
- 1602 Flanigan Way
- 237 Rushmore Ave
- 1848 Sandstone Dr
- 1757 Burgundy Ct
- 717 N Mcdowell Blvd Unit 511
- 1807 Turtle Creek Way
- 26 Jason Ct
- 1429 Dandelion Way
- 984 Hogwarts Cir
- 149 Jeffrey Dr
- 7 Michael Dr
- 1670 Northstar Ct
- 1666 Northstar Ct
- 1672 Northstar Dr
- 1664 Northstar Ct
- 1674 Northstar Dr
- 1662 Northstar Ct
- 1660 Northstar Dr
- 611 Acadia Dr
- 615 Acadia Dr
- 1676 Northstar Dr
- 609 Acadia Dr
- 1678 Northstar Dr
- 1658 Northstar Dr
- 1760 Rosamond St
- 607 Acadia Dr
- 1993 Rainier Cir
- 1995 Rainier Cir
- 1656 Northstar Dr
- 1667 Northstar Dr
- 1663 Northstar Dr
Your Personal Tour Guide
Ask me questions while you tour the home.