Estimated Value: $254,000 - $266,137
4
Beds
2
Baths
1,330
Sq Ft
$195/Sq Ft
Est. Value
About This Home
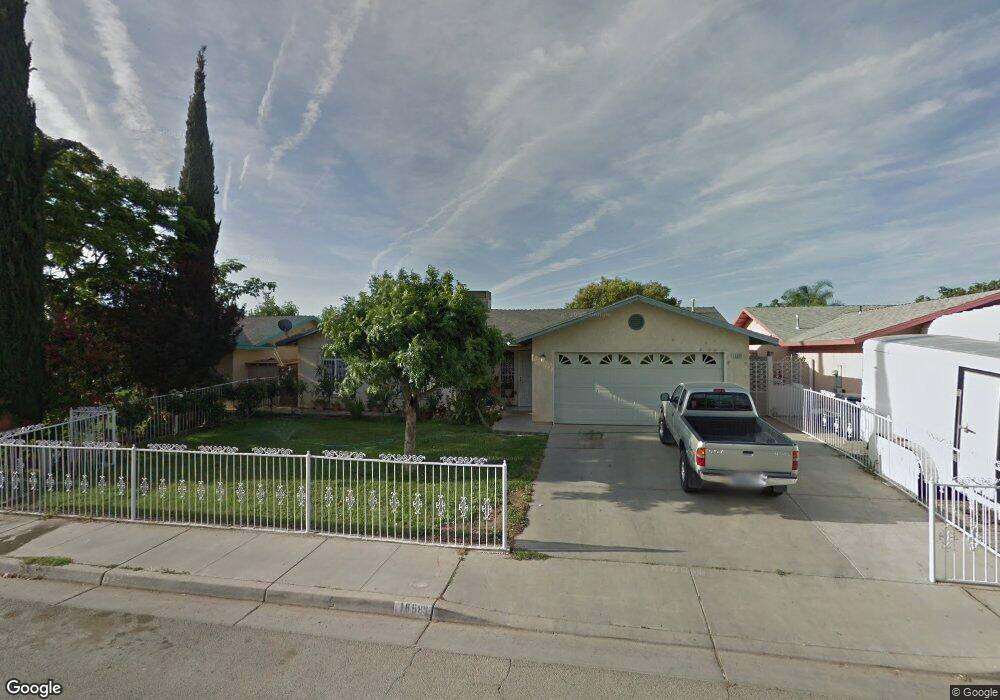
This home is located at 16689 3rd St, Huron, CA 93234 and is currently estimated at $259,379, approximately $195 per square foot. 16689 3rd St is a home with nearby schools including Huron Elementary School, Huron Middle School, and Coalinga High School.
Ownership History
Date
Name
Owned For
Owner Type
Purchase Details
Closed on
Mar 3, 2025
Sold by
Garcilazo Elias
Bought by
Garsilazo Carina
Current Estimated Value
Purchase Details
Closed on
May 8, 2003
Sold by
Garcilazo Elia
Bought by
Garcilazo Elias
Home Financials for this Owner
Home Financials are based on the most recent Mortgage that was taken out on this home.
Original Mortgage
$82,350
Interest Rate
4.95%
Purchase Details
Closed on
Apr 17, 1996
Sold by
Garcilazo Elia
Bought by
Garcilazo Elias
Purchase Details
Closed on
Jan 24, 1996
Sold by
Gong Chung C
Bought by
Garcilazo Elias and Gonzalez Rafael
Home Financials for this Owner
Home Financials are based on the most recent Mortgage that was taken out on this home.
Original Mortgage
$85,000
Interest Rate
7.41%
Create a Home Valuation Report for This Property
The Home Valuation Report is an in-depth analysis detailing your home's value as well as a comparison with similar homes in the area
Home Values in the Area
Average Home Value in this Area
Purchase History
| Date | Buyer | Sale Price | Title Company |
|---|---|---|---|
| Garsilazo Carina | -- | None Listed On Document | |
| Garcilazo Elias | -- | Chicago Title Company | |
| Garcilazo Elias | -- | Chicago Title Company | |
| Garcilazo Elias | -- | Central Title Company | |
| Garcilazo Elias | $80,500 | Central Title Company |
Source: Public Records
Mortgage History
| Date | Status | Borrower | Loan Amount |
|---|---|---|---|
| Previous Owner | Garcilazo Elias | $82,350 | |
| Previous Owner | Garcilazo Elias | $85,000 |
Source: Public Records
Tax History
| Year | Tax Paid | Tax Assessment Tax Assessment Total Assessment is a certain percentage of the fair market value that is determined by local assessors to be the total taxable value of land and additions on the property. | Land | Improvement |
|---|---|---|---|---|
| 2025 | $1,578 | $140,954 | $26,931 | $114,023 |
| 2023 | $1,555 | $135,483 | $25,886 | $109,597 |
| 2022 | $1,493 | $132,828 | $25,379 | $107,449 |
| 2021 | $1,486 | $130,225 | $24,882 | $105,343 |
| 2020 | $1,440 | $128,890 | $24,627 | $104,263 |
| 2019 | $1,418 | $126,364 | $24,145 | $102,219 |
| 2018 | $1,407 | $123,887 | $23,672 | $100,215 |
| 2017 | $1,355 | $121,458 | $23,208 | $98,250 |
| 2016 | $1,289 | $119,077 | $22,753 | $96,324 |
| 2015 | $1,239 | $117,290 | $22,412 | $94,878 |
| 2014 | $1,203 | $114,993 | $21,973 | $93,020 |
Source: Public Records
Map
Nearby Homes
- 20431 W Dorris Ave
- 0 California 198
- 0 26 Th Unit 202404659
- 41605 Sutter Ave
- 0 W Stutz Ave
- 28000 W Jayne Ave
- 1 065-294-03
- 00 S Dickenson Ave
- 0 Skyline Blvd
- 12678 California 33
- 26457 W Oakland Ave
- 29890 S El Dorado Ave
- 29000 S El Dorado Ave
- 0 25th Ave
- 90 Lost Hills Rd Hwy 33
- 0 W Jayne Ave Unit 13650674
- 0 W Jayne Ave Unit 225144445
- 0 W Jayne Ave Unit 622637
- 0 W Jayne Ave Unit FR25048985
- 0 W Jayne Ave Unit FR25048998
Your Personal Tour Guide
Ask me questions while you tour the home.