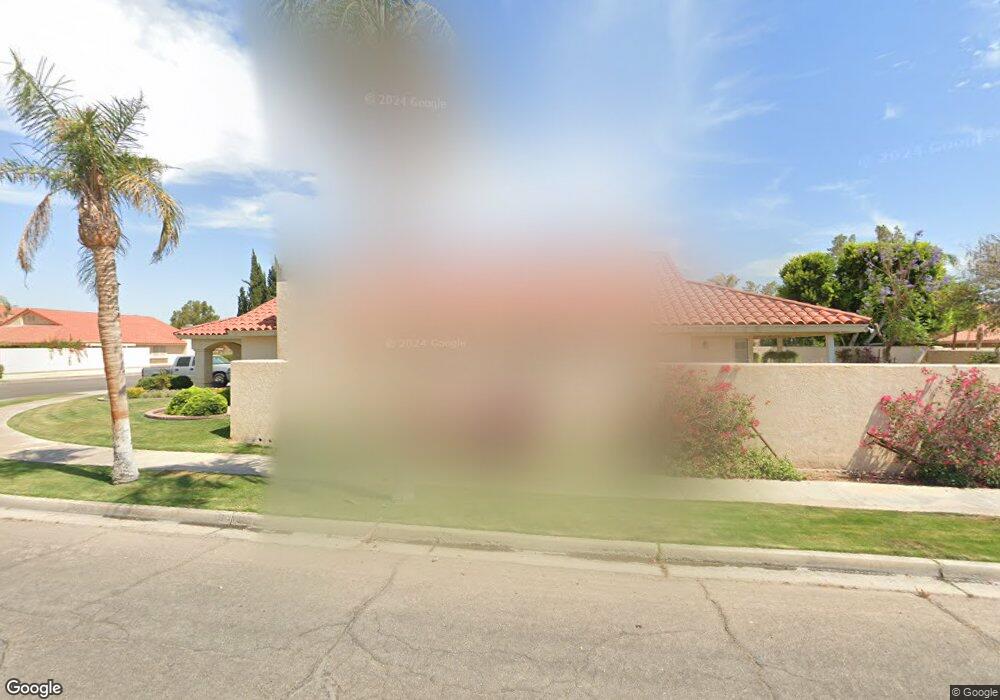
1669 Pepper Ct El Centro, CA 92243
Estimated Value: $533,010 - $663,000
4
Beds
2
Baths
2,303
Sq Ft
$263/Sq Ft
Est. Value
About This Home
This home is located at 1669 Pepper Ct, El Centro, CA 92243 and is currently estimated at $605,753, approximately $263 per square foot. 1669 Pepper Ct is a home located in Imperial County with nearby schools including De Anza Magnet, Wilson Jr. High, and Southwest High School.
Ownership History
Date
Name
Owned For
Owner Type
Purchase Details
Closed on
Feb 7, 2025
Sold by
Kennerson John W and Kennerson Cathy L
Bought by
John And Cathy Kennerson Family Trust and Kennerson
Current Estimated Value
Purchase Details
Closed on
Mar 5, 2003
Sold by
Kennerson John W
Bought by
Kennerson John W and Kennerson Cathy L
Home Financials for this Owner
Home Financials are based on the most recent Mortgage that was taken out on this home.
Original Mortgage
$176,500
Interest Rate
5.54%
Create a Home Valuation Report for This Property
The Home Valuation Report is an in-depth analysis detailing your home's value as well as a comparison with similar homes in the area
Purchase History
| Date | Buyer | Sale Price | Title Company |
|---|---|---|---|
| John And Cathy Kennerson Family Trust | -- | None Listed On Document | |
| Kennerson John W | -- | Chicago Title Co |
Source: Public Records
Mortgage History
| Date | Status | Borrower | Loan Amount |
|---|---|---|---|
| Previous Owner | Kennerson John W | $176,500 |
Source: Public Records
Tax History
| Year | Tax Paid | Tax Assessment Tax Assessment Total Assessment is a certain percentage of the fair market value that is determined by local assessors to be the total taxable value of land and additions on the property. | Land | Improvement |
|---|---|---|---|---|
| 2025 | $3,691 | $341,032 | $53,029 | $288,003 |
| 2023 | $3,691 | $327,791 | $50,971 | $276,820 |
| 2022 | $3,519 | $321,365 | $49,972 | $271,393 |
| 2021 | $3,427 | $315,065 | $48,993 | $266,072 |
| 2020 | $3,492 | $311,835 | $48,491 | $263,344 |
| 2019 | $3,384 | $305,722 | $47,541 | $258,181 |
| 2018 | $3,364 | $299,728 | $46,609 | $253,119 |
| 2017 | $3,328 | $293,852 | $45,696 | $248,156 |
| 2016 | $3,259 | $288,091 | $44,800 | $243,291 |
| 2015 | $3,210 | $283,765 | $44,128 | $239,637 |
| 2014 | $2,652 | $236,000 | $70,000 | $166,000 |
Source: Public Records
Map
Nearby Homes
- 1401 S La Brucherie Rd Unit 14
- 1849 Lotus Ave
- 1926 Lenrey Ave
- 224 E Aurora Dr
- 2051 W Elm Ave
- 2739 Sandalwood Dr
- 1611 Yucca Dr
- 1835 Barbara Way
- 1581 Pepper Dr
- 2251 W Orange Ave
- 1425 Pepper Dr
- 435 S Haskell Dr
- 1500 W Hamilton Ave
- 1578 W Orange Ave Unit 1574
- 1716 W Brighton Ave Unit D
- 940 Salton Sea
- 467 S Haskell Dr
- 1245 Aurora Dr
- 336 S Waterman Ave Unit B
- 1090 Aurora Dr
- 1647 Pepper Ct
- 1625 Pepper Ct
- 1590 S 22nd St
- 2217 Pepper Dr
- 2223 Pepper Dr
- 1550 S 22nd St
- 2249 Pepper Dr
- 2207 Pepper Dr
- 1692 Pepper Ct
- 1668 Pepper Ct
- 2249 0 Pepper Dr
- 1603 Pepper Ct
- 2201 Pepper Dr
- 2257 Pepper Dr
- 2230 Pepper Dr
- 1490 S 22nd St
- 2244 Aurora Ct
- 2292 Aurora Ct
- 2238 Pepper Dr
- 2226 Aurora Ct
Your Personal Tour Guide
Ask me questions while you tour the home.