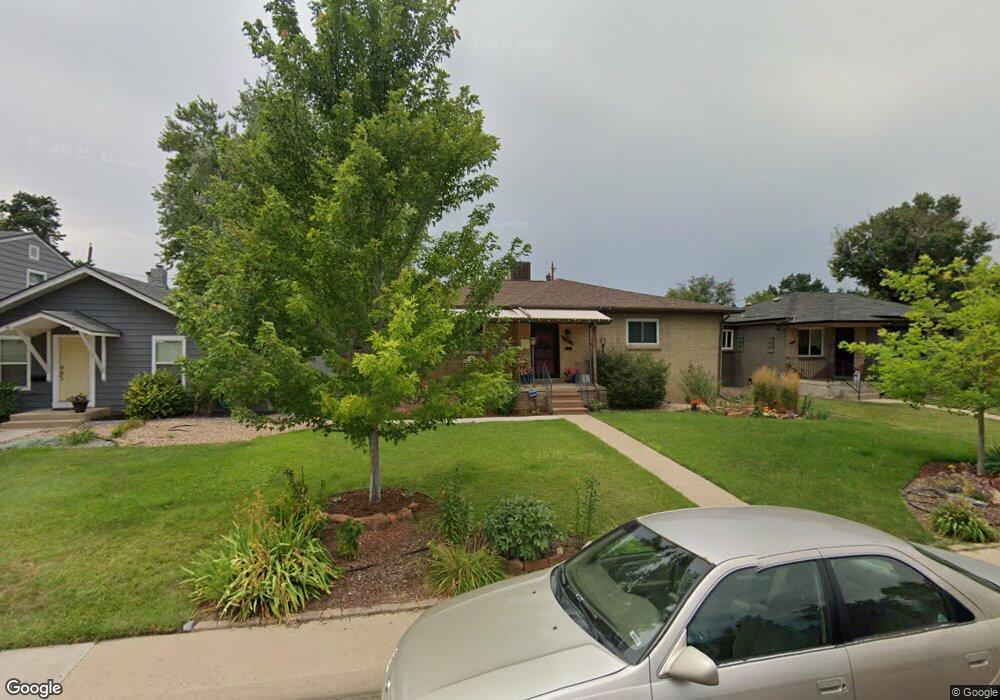
1669 Xenia St Denver, CO 80220
East Colfax NeighborhoodEstimated Value: $575,000 - $658,876
3
Beds
2
Baths
3,060
Sq Ft
$201/Sq Ft
Est. Value
About This Home
This home is located at 1669 Xenia St, Denver, CO 80220 and is currently estimated at $613,969, approximately $200 per square foot. 1669 Xenia St is a home located in Denver County with nearby schools including Hill Campus of Arts & Sciences, George Washington High School, and DSST: Montview Middle School.
Ownership History
Date
Name
Owned For
Owner Type
Purchase Details
Closed on
Apr 27, 2016
Sold by
Sims Darlene
Bought by
Lundeen Scott and Lundeen Melanie
Current Estimated Value
Home Financials for this Owner
Home Financials are based on the most recent Mortgage that was taken out on this home.
Original Mortgage
$324,425
Outstanding Balance
$258,685
Interest Rate
3.71%
Mortgage Type
New Conventional
Estimated Equity
$355,284
Purchase Details
Closed on
Aug 8, 2008
Sold by
Lyons Tanya R and Lyons Christa
Bought by
Sims Darlene
Home Financials for this Owner
Home Financials are based on the most recent Mortgage that was taken out on this home.
Original Mortgage
$65,000
Interest Rate
6.38%
Mortgage Type
Purchase Money Mortgage
Create a Home Valuation Report for This Property
The Home Valuation Report is an in-depth analysis detailing your home's value as well as a comparison with similar homes in the area
Home Values in the Area
Average Home Value in this Area
Purchase History
| Date | Buyer | Sale Price | Title Company |
|---|---|---|---|
| Lundeen Scott | $341,501 | Stewart Title | |
| Sims Darlene | $165,000 | Fgt |
Source: Public Records
Mortgage History
| Date | Status | Borrower | Loan Amount |
|---|---|---|---|
| Open | Lundeen Scott | $324,425 | |
| Previous Owner | Sims Darlene | $65,000 |
Source: Public Records
Tax History Compared to Growth
Tax History
| Year | Tax Paid | Tax Assessment Tax Assessment Total Assessment is a certain percentage of the fair market value that is determined by local assessors to be the total taxable value of land and additions on the property. | Land | Improvement |
|---|---|---|---|---|
| 2024 | $3,467 | $43,780 | $6,780 | $37,000 |
| 2023 | $3,392 | $43,780 | $6,780 | $37,000 |
| 2022 | $2,762 | $34,730 | $9,760 | $24,970 |
| 2021 | $2,667 | $35,740 | $10,050 | $25,690 |
| 2020 | $2,362 | $31,840 | $10,050 | $21,790 |
| 2019 | $2,296 | $31,840 | $10,050 | $21,790 |
| 2018 | $1,975 | $25,530 | $5,400 | $20,130 |
| 2017 | $1,969 | $25,530 | $5,400 | $20,130 |
| 2016 | $1,677 | $20,570 | $4,474 | $16,096 |
| 2015 | $1,607 | $20,570 | $4,474 | $16,096 |
| 2014 | $1,148 | $13,820 | $3,980 | $9,840 |
Source: Public Records
Map
Nearby Homes
- 1610 Xanthia St
- 8801 E 16th Ave
- 1558 Xenia St
- 1565 Xanthia St
- 1537 Xenia St
- 1533 Xenia St
- 1537 Willow St
- 1695 Alton St
- 1675 Wabash St
- 1760 Wabash St
- 1569 Wabash St
- 1926 Xenia St
- 1588 Verbena St
- 1564 Verbena St
- 1675 Verbena St
- 1444 Willow St
- 1416 Willow St
- 9011 E 14th Ave
- 1738 Boston St
- 1320 Willow St