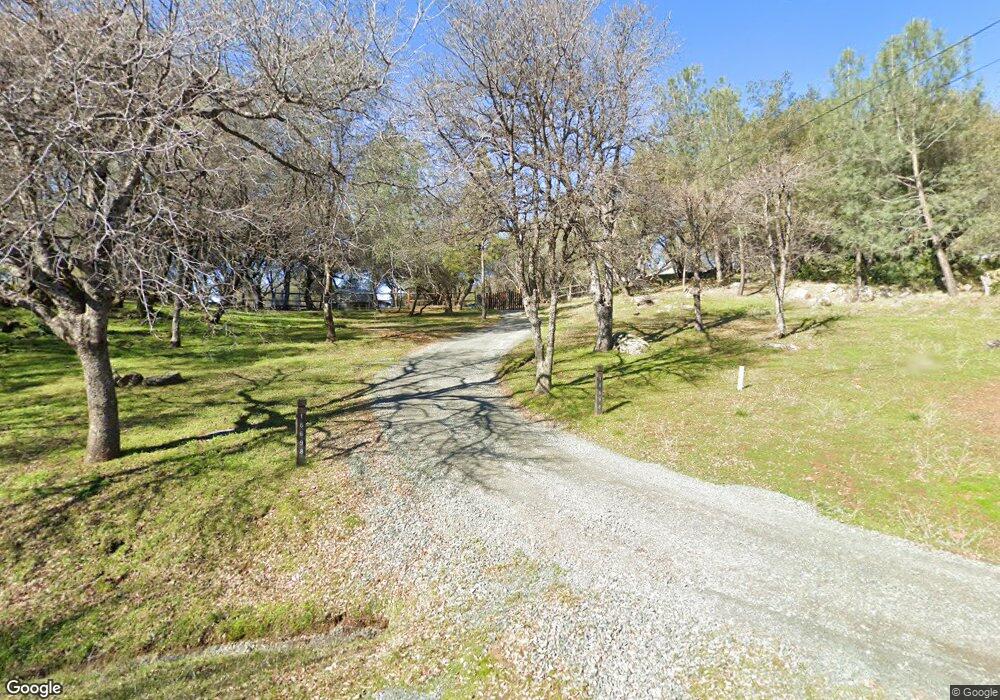
16698 Rocker Rd Rough and Ready, CA 95975
Estimated Value: $412,000 - $505,969
3
Beds
3
Baths
1,879
Sq Ft
$244/Sq Ft
Est. Value
About This Home
This home is located at 16698 Rocker Rd, Rough and Ready, CA 95975 and is currently estimated at $458,242, approximately $243 per square foot. 16698 Rocker Rd is a home located in Nevada County with nearby schools including Ready Springs Elementary School, Williams Ranch Elementary School, and Vantage Point Charter School.
Ownership History
Date
Name
Owned For
Owner Type
Purchase Details
Closed on
Oct 6, 2008
Sold by
Waschevski Alan and Waschevski Geralyn
Bought by
Waschevski Alan J and Waschevski Geralyn Kurtz
Current Estimated Value
Purchase Details
Closed on
Apr 22, 2005
Sold by
Waschevski Alan and Waschevski Geralyn
Bought by
Deppe Gregory and Deppe Sara
Purchase Details
Closed on
Feb 18, 2000
Sold by
Ramos Mary G
Bought by
Waschevski Alan and Waschevski Geralyn
Home Financials for this Owner
Home Financials are based on the most recent Mortgage that was taken out on this home.
Original Mortgage
$155,000
Interest Rate
8.16%
Mortgage Type
Purchase Money Mortgage
Create a Home Valuation Report for This Property
The Home Valuation Report is an in-depth analysis detailing your home's value as well as a comparison with similar homes in the area
Purchase History
| Date | Buyer | Sale Price | Title Company |
|---|---|---|---|
| Waschevski Alan J | -- | None Available | |
| Deppe Gregory | -- | United Independent Title Ins | |
| Waschevski Alan | -- | United Independent Title Ins | |
| Waschevski Alan | $185,000 | First American Title Ins Co | |
| Ramos Mary G | -- | First American Title Ins Co |
Source: Public Records
Mortgage History
| Date | Status | Borrower | Loan Amount |
|---|---|---|---|
| Previous Owner | Waschevski Alan | $155,000 |
Source: Public Records
Tax History
| Year | Tax Paid | Tax Assessment Tax Assessment Total Assessment is a certain percentage of the fair market value that is determined by local assessors to be the total taxable value of land and additions on the property. | Land | Improvement |
|---|---|---|---|---|
| 2025 | $3,423 | $312,028 | $85,289 | $226,739 |
| 2024 | $3,355 | $305,911 | $83,617 | $222,294 |
| 2023 | $3,355 | $299,914 | $81,978 | $217,936 |
| 2022 | $3,279 | $294,034 | $80,371 | $213,663 |
| 2021 | $3,193 | $288,270 | $78,796 | $209,474 |
| 2020 | $3,188 | $285,316 | $77,989 | $207,327 |
| 2019 | $3,124 | $279,722 | $76,460 | $203,262 |
| 2018 | $0 | $274,238 | $74,961 | $199,277 |
| 2017 | $2,792 | $268,863 | $73,492 | $195,371 |
| 2016 | $2,688 | $263,592 | $72,051 | $191,541 |
| 2015 | $2,650 | $259,634 | $70,969 | $188,665 |
| 2014 | $2,609 | $254,550 | $69,579 | $184,971 |
Source: Public Records
Map
Nearby Homes
- 16260 Hillaire Rd
- 10428 Riffle Box Rd
- 10720 Rough And Ready Rd
- 15655 Rough And Ready Hwy
- 12880 Lake Wildwood Dr
- 10757 Oak Hill Dr
- 17843 Lake Forest Dr
- 17862 Whitefish Ct
- 10185 Valley Dr
- 12716 Roadrunner Dr
- 13558 Lake Wildwood Dr
- 14263 Beitler Rd
- 18098 Lake Forest Dr
- 11585 Linnet Ct
- 13731 Sun Forest Dr
- 12964 Roadrunner Dr
- 18330 Hummingbird Dr
- 18410 Blue Teal Loop
- 10151 Trauner Ln
- 13980 Mountain House Rd
Your Personal Tour Guide
Ask me questions while you tour the home.