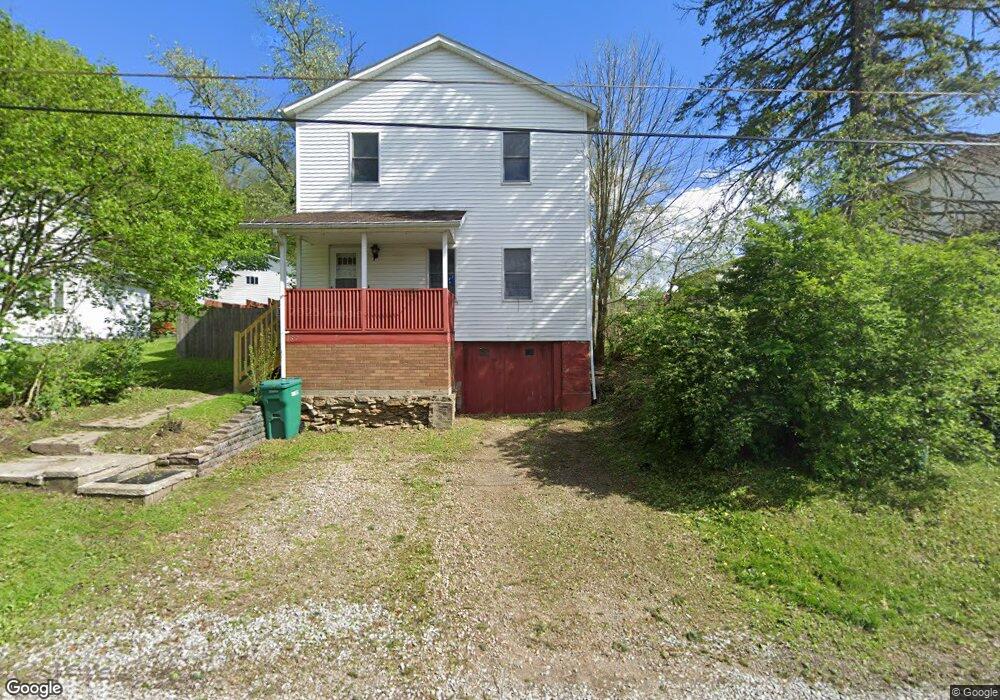
167 11th St Lucernemines, PA 15754
Estimated Value: $86,000 - $107,000
3
Beds
2
Baths
1,344
Sq Ft
$72/Sq Ft
Est. Value
About This Home
This home is located at 167 11th St, Lucernemines, PA 15754 and is currently estimated at $96,456, approximately $71 per square foot. 167 11th St is a home with nearby schools including Homer-Center Elementary School and Homer-Center Junior/Senior High School.
Ownership History
Date
Name
Owned For
Owner Type
Purchase Details
Closed on
Apr 24, 2024
Sold by
Webb Andrew and Webb Nancy M
Bought by
Debuyser Joshua C and Debuyser Joellen
Current Estimated Value
Home Financials for this Owner
Home Financials are based on the most recent Mortgage that was taken out on this home.
Original Mortgage
$82,692
Outstanding Balance
$81,423
Interest Rate
6.74%
Mortgage Type
New Conventional
Estimated Equity
$15,033
Purchase Details
Closed on
Jun 28, 2012
Sold by
Mcnutt Kris B and Mcnutt Sandra J
Bought by
Webb Andrew and Webb Nancy M
Home Financials for this Owner
Home Financials are based on the most recent Mortgage that was taken out on this home.
Original Mortgage
$76,587
Interest Rate
3.78%
Mortgage Type
FHA
Create a Home Valuation Report for This Property
The Home Valuation Report is an in-depth analysis detailing your home's value as well as a comparison with similar homes in the area
Home Values in the Area
Average Home Value in this Area
Purchase History
| Date | Buyer | Sale Price | Title Company |
|---|---|---|---|
| Debuyser Joshua C | $85,250 | One Abstract Services | |
| Webb Andrew | $78,000 | None Available |
Source: Public Records
Mortgage History
| Date | Status | Borrower | Loan Amount |
|---|---|---|---|
| Open | Debuyser Joshua C | $82,692 | |
| Previous Owner | Webb Andrew | $76,587 |
Source: Public Records
Tax History Compared to Growth
Tax History
| Year | Tax Paid | Tax Assessment Tax Assessment Total Assessment is a certain percentage of the fair market value that is determined by local assessors to be the total taxable value of land and additions on the property. | Land | Improvement |
|---|---|---|---|---|
| 2025 | $1,975 | $78,800 | $12,000 | $66,800 |
| 2024 | $1,943 | $78,800 | $12,000 | $66,800 |
| 2023 | $1,828 | $78,800 | $12,000 | $66,800 |
| 2022 | $1,808 | $78,800 | $12,000 | $66,800 |
| 2021 | $1,808 | $78,800 | $12,000 | $66,800 |
| 2020 | $1,772 | $78,800 | $12,000 | $66,800 |
| 2018 | $1,750 | $78,800 | $12,000 | $66,800 |
| 2017 | $1,435 | $78,800 | $12,000 | $66,800 |
| 2016 | -- | $78,800 | $12,000 | $66,800 |
| 2015 | -- | $4,130 | $590 | $3,540 |
| 2014 | -- | $4,130 | $590 | $3,540 |
Source: Public Records
Map
Nearby Homes