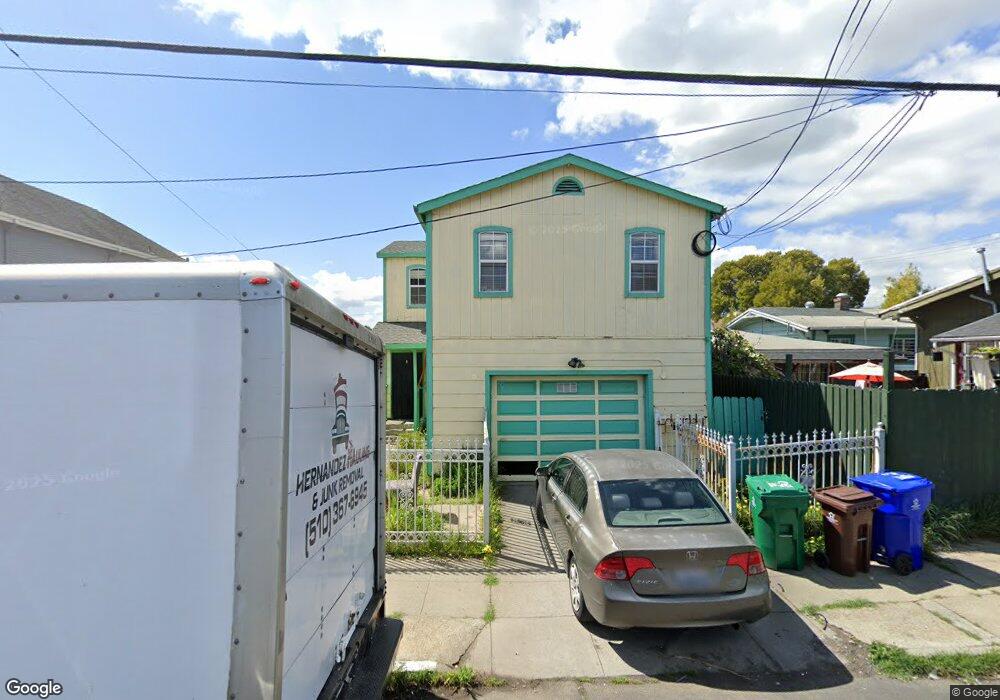
167 17th St Richmond, CA 94801
City Central NeighborhoodEstimated Value: $458,000 - $592,000
3
Beds
3
Baths
1,488
Sq Ft
$358/Sq Ft
Est. Value
About This Home
This home is located at 167 17th St, Richmond, CA 94801 and is currently estimated at $533,339, approximately $358 per square foot. 167 17th St is a home located in Contra Costa County with nearby schools including Nystrom Elementary School, Lovonya DeJean Middle School, and John F. Kennedy High School.
Ownership History
Date
Name
Owned For
Owner Type
Purchase Details
Closed on
Nov 9, 2020
Sold by
Tripp Shu Zhen
Bought by
Tripp Shu Zhen and Shu Zhen Tripp 2020 Trust
Current Estimated Value
Purchase Details
Closed on
Aug 31, 2010
Sold by
Tripp Walter Yu and Tripp Shu Zhen
Bought by
Tripp Shu Zhen
Purchase Details
Closed on
Jan 29, 2010
Sold by
Us Bank National Association
Bought by
Tripp Walter Yu and Tripp Shu Zhen
Purchase Details
Closed on
Jul 3, 2009
Sold by
Velis Edelmira De Jesus
Bought by
Us Bank National Association
Purchase Details
Closed on
Jun 2, 2005
Sold by
Crossley Pamela
Bought by
Velis Edelmira De Jesus
Home Financials for this Owner
Home Financials are based on the most recent Mortgage that was taken out on this home.
Original Mortgage
$359,000
Interest Rate
5.37%
Mortgage Type
Purchase Money Mortgage
Create a Home Valuation Report for This Property
The Home Valuation Report is an in-depth analysis detailing your home's value as well as a comparison with similar homes in the area
Home Values in the Area
Average Home Value in this Area
Purchase History
| Date | Buyer | Sale Price | Title Company |
|---|---|---|---|
| Tripp Shu Zhen | -- | None Available | |
| Tripp Shu Zhen | $54,000 | None Available | |
| Tripp Walter Yu | $107,000 | North American Title Co | |
| Us Bank National Association | $132,000 | Accommodation | |
| Velis Edelmira De Jesus | $460,000 | Fidelity National Title |
Source: Public Records
Mortgage History
| Date | Status | Borrower | Loan Amount |
|---|---|---|---|
| Previous Owner | Velis Edelmira De Jesus | $359,000 |
Source: Public Records
Tax History
| Year | Tax Paid | Tax Assessment Tax Assessment Total Assessment is a certain percentage of the fair market value that is determined by local assessors to be the total taxable value of land and additions on the property. | Land | Improvement |
|---|---|---|---|---|
| 2025 | $3,486 | $137,843 | $47,816 | $90,027 |
| 2024 | $3,404 | $135,141 | $46,879 | $88,262 |
| 2023 | $3,404 | $132,492 | $45,960 | $86,532 |
| 2022 | $3,310 | $129,895 | $45,059 | $84,836 |
| 2021 | $3,239 | $127,349 | $44,176 | $83,173 |
| 2019 | $3,034 | $123,574 | $42,867 | $80,707 |
| 2018 | $2,921 | $121,152 | $42,027 | $79,125 |
| 2017 | $2,837 | $118,777 | $41,203 | $77,574 |
| 2016 | $2,769 | $116,449 | $40,396 | $76,053 |
| 2015 | $2,728 | $114,701 | $39,790 | $74,911 |
| 2014 | $2,710 | $112,455 | $39,011 | $73,444 |
Source: Public Records
Map
Nearby Homes
Your Personal Tour Guide
Ask me questions while you tour the home.