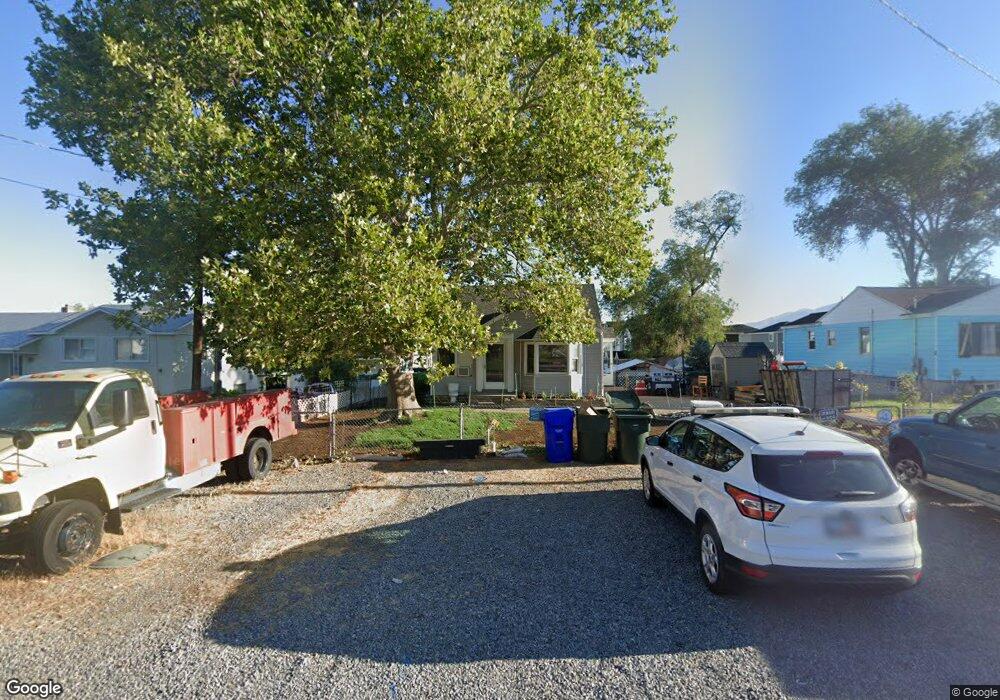
167 E 700 N Tooele, UT 84074
Estimated Value: $323,000 - $407,000
4
Beds
2
Baths
1,806
Sq Ft
$201/Sq Ft
Est. Value
About This Home
This home is located at 167 E 700 N, Tooele, UT 84074 and is currently estimated at $362,977, approximately $200 per square foot. 167 E 700 N is a home located in Tooele County with nearby schools including Sterling Elementary School, Tooele Junior High School, and Tooele High School.
Ownership History
Date
Name
Owned For
Owner Type
Purchase Details
Closed on
Sep 29, 2021
Sold by
Colvin Lyle B and Colvin Joan M
Bought by
Dove Jamic Delane and Villescas David Curds
Current Estimated Value
Home Financials for this Owner
Home Financials are based on the most recent Mortgage that was taken out on this home.
Original Mortgage
$318,181
Outstanding Balance
$291,027
Interest Rate
3.01%
Mortgage Type
New Conventional
Estimated Equity
$71,950
Purchase Details
Closed on
Mar 30, 2015
Sold by
Oliver Joan M
Bought by
Oliver Joan M
Purchase Details
Closed on
Dec 27, 2005
Sold by
Nelson Kenneth and Nelson Lisa
Bought by
Oliver Joan M
Home Financials for this Owner
Home Financials are based on the most recent Mortgage that was taken out on this home.
Original Mortgage
$76,800
Interest Rate
6.36%
Mortgage Type
New Conventional
Create a Home Valuation Report for This Property
The Home Valuation Report is an in-depth analysis detailing your home's value as well as a comparison with similar homes in the area
Purchase History
| Date | Buyer | Sale Price | Title Company |
|---|---|---|---|
| Dove Jamic Delane | -- | Old Republic Title | |
| Oliver Joan M | -- | None Available | |
| Oliver Joan M | -- | Integrated Title Insurance S |
Source: Public Records
Mortgage History
| Date | Status | Borrower | Loan Amount |
|---|---|---|---|
| Open | Dove Jamic Delane | $318,181 | |
| Previous Owner | Oliver Joan M | $76,800 |
Source: Public Records
Tax History
| Year | Tax Paid | Tax Assessment Tax Assessment Total Assessment is a certain percentage of the fair market value that is determined by local assessors to be the total taxable value of land and additions on the property. | Land | Improvement |
|---|---|---|---|---|
| 2025 | $2,393 | $362,867 | $86,450 | $276,417 |
| 2024 | $2,573 | $196,399 | $47,548 | $148,851 |
| 2023 | $2,573 | $185,633 | $45,760 | $139,873 |
| 2022 | $1,945 | $167,298 | $56,547 | $110,751 |
| 2021 | $1,546 | $111,220 | $22,619 | $88,601 |
| 2020 | $1,503 | $187,573 | $41,125 | $146,448 |
| 2019 | $1,372 | $168,471 | $41,125 | $127,346 |
| 2018 | $1,338 | $155,736 | $45,000 | $110,736 |
| 2017 | $1,156 | $159,700 | $20,000 | $139,700 |
| 2016 | $939 | $77,813 | $11,000 | $66,813 |
| 2015 | $939 | $68,312 | $0 | $0 |
| 2014 | -- | $68,312 | $0 | $0 |
Source: Public Records
Map
Nearby Homes
- 151 E 730 N
- 698 Brook Ave E
- 135 E 730 N
- 252 E 715 N Unit 216
- 261 E 670 N Unit 220
- 79 E 600 N
- 294 E 600 N
- 498 Parkway Ave
- 465 N 100 E
- 367 E 740 N
- 516 N Broadway Ave
- 332 E 880 N
- 931 Brook Ave E Unit A
- 466 N Main St Unit 10
- 610 N 100 W
- 395 N 1st St
- 337 E 910 N
- 237 E 960 N Unit D
- 324 N 100 E
- 535 E 670 N
- 187 E 700 N
- 157 E 700 N
- 712 N 160 E
- 712 N 160 E Unit 116
- 714 N 160 E
- 714 N 160 E Unit 117
- 201 E 700 N
- 697 Nelson Ave
- 716 N 160 E Unit 118
- 698 Nelson Ave
- 719 N 160 E Unit 113
- 705 N Brook Ave
- 718 N 160 E Unit 119
- 707 N Brook Ave
- 722 N 160 E
- 722 N 160 E Unit 120
- 698 N Parkway Ave
- Bevan Estates Model Home
- 685 Nelson Ave
- 724 N 160 E Unit 121
Your Personal Tour Guide
Ask me questions while you tour the home.