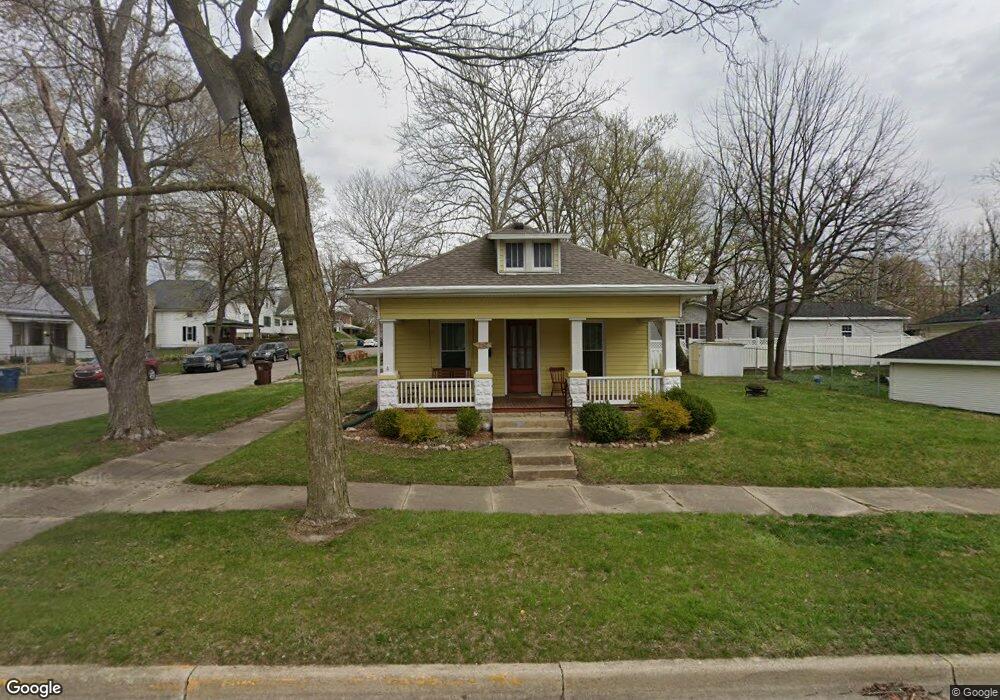
167 N Allen St Wabash, IN 46992
Estimated Value: $95,000 - $116,000
2
Beds
1
Bath
912
Sq Ft
$113/Sq Ft
Est. Value
About This Home
This home is located at 167 N Allen St, Wabash, IN 46992 and is currently estimated at $103,303, approximately $113 per square foot. 167 N Allen St is a home located in Wabash County with nearby schools including O.J. Neighbours Elementary School, W C Mills Elementary School, and Wabash Middle School.
Ownership History
Date
Name
Owned For
Owner Type
Purchase Details
Closed on
Jun 2, 2025
Sold by
Dargo Llc
Bought by
Reynolds Brewing Co Llc
Current Estimated Value
Purchase Details
Closed on
Mar 3, 2023
Sold by
Henderson Kryston E
Bought by
Dargo Llc
Home Financials for this Owner
Home Financials are based on the most recent Mortgage that was taken out on this home.
Original Mortgage
$67,500
Interest Rate
5.28%
Mortgage Type
New Conventional
Purchase Details
Closed on
May 22, 2017
Sold by
Cochran Andrew D
Bought by
Henderson Kryston E
Home Financials for this Owner
Home Financials are based on the most recent Mortgage that was taken out on this home.
Original Mortgage
$40,960
Interest Rate
4.1%
Mortgage Type
Commercial
Purchase Details
Closed on
Jan 25, 2008
Sold by
Guthrie James L and Guthrie Nancy A
Bought by
Cochran Andrew D
Home Financials for this Owner
Home Financials are based on the most recent Mortgage that was taken out on this home.
Original Mortgage
$37,350
Interest Rate
6.11%
Mortgage Type
New Conventional
Create a Home Valuation Report for This Property
The Home Valuation Report is an in-depth analysis detailing your home's value as well as a comparison with similar homes in the area
Home Values in the Area
Average Home Value in this Area
Purchase History
| Date | Buyer | Sale Price | Title Company |
|---|---|---|---|
| Reynolds Brewing Co Llc | -- | None Listed On Document | |
| Dargo Llc | $90,000 | -- | |
| Henderson Kryston E | -- | None Available | |
| Cochran Andrew D | -- | -- |
Source: Public Records
Mortgage History
| Date | Status | Borrower | Loan Amount |
|---|---|---|---|
| Previous Owner | Dargo Llc | $67,500 | |
| Previous Owner | Henderson Kryston E | $40,960 | |
| Previous Owner | Cochran Andrew D | $37,350 |
Source: Public Records
Tax History Compared to Growth
Tax History
| Year | Tax Paid | Tax Assessment Tax Assessment Total Assessment is a certain percentage of the fair market value that is determined by local assessors to be the total taxable value of land and additions on the property. | Land | Improvement |
|---|---|---|---|---|
| 2024 | $1,422 | $71,100 | $7,100 | $64,000 |
| 2023 | $470 | $67,200 | $7,100 | $60,100 |
| 2022 | $447 | $62,600 | $7,100 | $55,500 |
| 2021 | $395 | $58,000 | $7,100 | $50,900 |
| 2020 | $353 | $53,300 | $7,100 | $46,200 |
| 2019 | $283 | $50,800 | $7,100 | $43,700 |
| 2018 | $281 | $50,300 | $7,100 | $43,200 |
| 2017 | $300 | $48,800 | $7,100 | $41,700 |
| 2016 | $246 | $48,200 | $7,100 | $41,100 |
| 2014 | $199 | $48,300 | $7,100 | $41,200 |
| 2013 | $160 | $47,400 | $7,100 | $40,300 |
Source: Public Records
Map
Nearby Homes
- 35 E Sinclair St
- 387 N Wabash St
- 425 N Huntington St
- 459 E Hill St
- 244 N Miami St
- 153 Ferry St
- 102 Stitt St
- 41 Noble St
- 747 N Spring St
- 334 Ferry St
- 739 Congress St
- 492 W Maple St
- 125 N Comstock St
- 27 N Comstock St
- 516 W Hill St
- 495 Stitt St
- 495 Manchester Ave
- 472 Vermont St
- 765 Lafontaine Ave
- 8 Creekside Ln
- 231 E Maple St
- 157 N Allen St
- 145 N Allen St
- 206 E Maple St
- 224 E Maple St
- 193 E Maple St
- 245 E Maple St
- 125 N Allen St
- 244 E Maple St
- 188 E Maple St
- 177 E Maple St
- 109 N Allen St
- 259 E Maple St
- 256 E Maple St
- 222 E Sinclair St
- 260 E Maple St
- 273 E Maple St
- 161 E Maple St
- 242 E Sinclair St
- 268 E Maple St