Estimated Value: $62,000 - $181,000
3
Beds
2
Baths
1,500
Sq Ft
$87/Sq Ft
Est. Value
About This Home
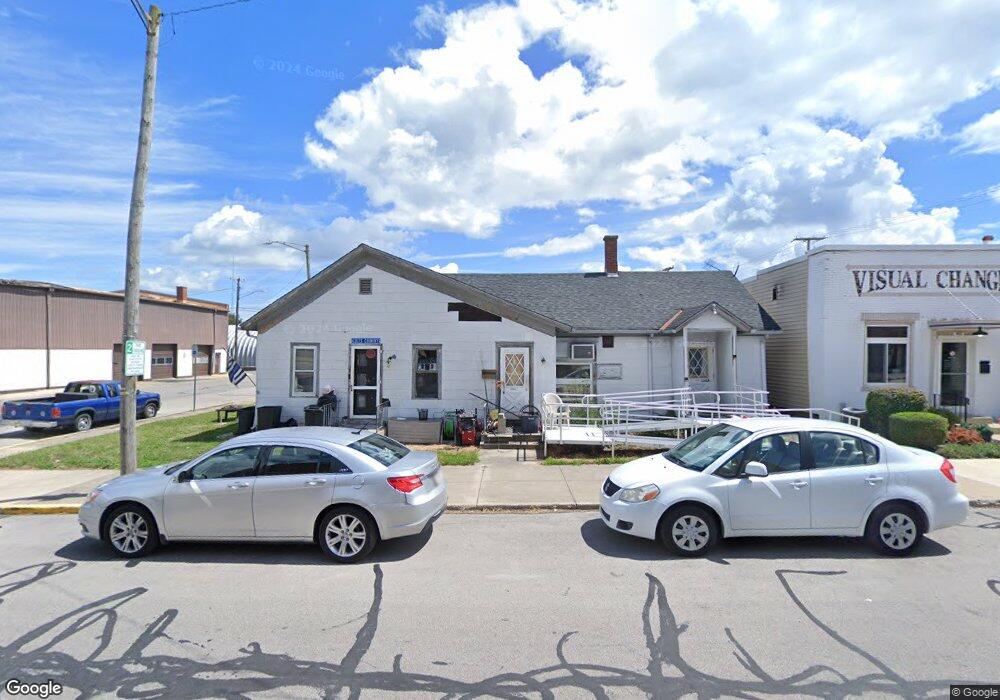
This home is located at 167 N Jefferson St, Berne, IN 46711 and is currently estimated at $130,951, approximately $87 per square foot. 167 N Jefferson St is a home located in Adams County with nearby schools including South Adams Elementary School, South Adams Middle School, and South Adams High School.
Ownership History
Date
Name
Owned For
Owner Type
Purchase Details
Closed on
Apr 26, 2021
Sold by
Robinson Pk Llc
Bought by
Royal Feast Llc
Current Estimated Value
Purchase Details
Closed on
Oct 16, 2017
Sold by
Robinson Real Estate Llc
Bought by
Ribinson Pk Llc
Purchase Details
Closed on
Dec 24, 2013
Sold by
Jerry Lee Riley Living Trust
Bought by
J & M Riley Realty Llc
Purchase Details
Closed on
Jul 2, 2013
Sold by
Pk Rws Llc
Bought by
Robinson Pk Llc
Purchase Details
Closed on
Apr 11, 2013
Sold by
Riley Real Estate Llc
Bought by
Jerry Lee Riley Living Trust and Myrlam Joann Lee Riley Living Trust
Purchase Details
Closed on
Apr 8, 2013
Sold by
Gilbert A Robinson Revoc Living Trust
Bought by
Robinson Real Estate Llc Company Of Indi
Purchase Details
Closed on
Nov 28, 2009
Sold by
Riley Jerry L
Bought by
Jerry Lee Riley Living Trust
Create a Home Valuation Report for This Property
The Home Valuation Report is an in-depth analysis detailing your home's value as well as a comparison with similar homes in the area
Home Values in the Area
Average Home Value in this Area
Purchase History
| Date | Buyer | Sale Price | Title Company |
|---|---|---|---|
| Royal Feast Llc | $6,531 | None Available | |
| Ribinson Pk Llc | -- | None Available | |
| J & M Riley Realty Llc | -- | None Available | |
| Robinson Pk Llc | -- | None Available | |
| Jerry Lee Riley Living Trust | -- | None Available | |
| Robinson Real Estate Llc Company Of Indi | -- | None Available | |
| Jerry Lee Riley Living Trust | -- | None Available |
Source: Public Records
Tax History Compared to Growth
Tax History
| Year | Tax Paid | Tax Assessment Tax Assessment Total Assessment is a certain percentage of the fair market value that is determined by local assessors to be the total taxable value of land and additions on the property. | Land | Improvement |
|---|---|---|---|---|
| 2024 | $380 | $54,600 | $10,000 | $44,600 |
| 2023 | $358 | $51,600 | $10,000 | $41,600 |
| 2022 | $321 | $47,900 | $10,000 | $37,900 |
| 2021 | $300 | $44,100 | $9,500 | $34,600 |
| 2020 | $290 | $41,900 | $9,500 | $32,400 |
| 2019 | $271 | $39,900 | $9,500 | $30,400 |
| 2018 | $269 | $38,300 | $9,500 | $28,800 |
| 2017 | $252 | $37,700 | $10,000 | $27,700 |
| 2016 | $240 | $37,100 | $10,000 | $27,100 |
| 2014 | $223 | $37,000 | $10,000 | $27,000 |
| 2013 | $973 | $32,900 | $12,300 | $20,600 |
Source: Public Records
Map
Nearby Homes
- 260 S Jefferson St
- 609 Welty St
- 156 Bryan St
- 155 Oregon St
- 766 W Van Buren St
- 1018 W Water St
- 1106 Clark St
- 1105 Clark St
- 1224 W Clark
- TBD Hahnemann Ct
- 1346 Stuckistrasse
- 1075 Black Bear Path
- 120 Hahnemann Ct
- 1750 Oakwood Ln
- 2422 W 700 S
- TBD E Shore Dr
- 630 N Main St
- 195 Wabash Valley Dr
- 570 Winchester Rd
- 240 Old Hickory Ln
- 118 E Water St
- 159 N Jefferson St
- 155 Behring St
- 109 E Main St
- 101 E Main St
- 164 N Jefferson St
- 103 & 109 E Main St
- 163 Behring St
- 105 W Main St
- 218 N Jefferson St
- 154 W Water St
- 217 Behring St
- 151 W Main St
- 104 E Main St
- 256 N Jefferson St
- 265 N Jefferson St
- 255 Behring St
- 164 W Washington St
- 102 W Main St
- 169 W Main St