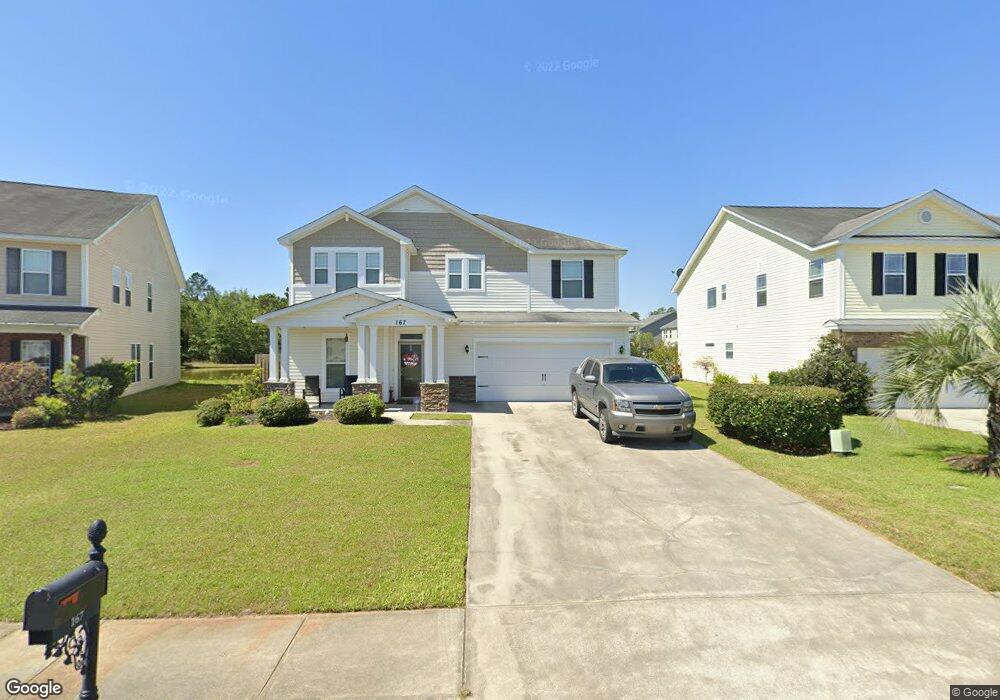
167 Pine View Crossing Pooler, GA 31322
Estimated Value: $368,821 - $427,000
3
Beds
3
Baths
2,236
Sq Ft
$174/Sq Ft
Est. Value
About This Home
This home is located at 167 Pine View Crossing, Pooler, GA 31322 and is currently estimated at $387,955, approximately $173 per square foot. 167 Pine View Crossing is a home located in Chatham County with nearby schools including West Chatham Elementary School, West Chatham Middle School, and New Hampstead High School.
Ownership History
Date
Name
Owned For
Owner Type
Purchase Details
Closed on
Jun 13, 2016
Sold by
Loyd Laquana N
Bought by
Loyd Laquana N and Loyd Clifton D
Current Estimated Value
Purchase Details
Closed on
Jan 15, 2016
Sold by
Postreich Jeremy Nicholas
Bought by
Loyd Laquana N
Home Financials for this Owner
Home Financials are based on the most recent Mortgage that was taken out on this home.
Original Mortgage
$209,000
Interest Rate
3.99%
Mortgage Type
New Conventional
Purchase Details
Closed on
Feb 6, 2009
Sold by
Not Provided
Bought by
Postreich Jeremy Nicholas and Postreich Sarah L
Home Financials for this Owner
Home Financials are based on the most recent Mortgage that was taken out on this home.
Original Mortgage
$188,151
Interest Rate
5.07%
Mortgage Type
FHA
Purchase Details
Closed on
Jan 10, 2007
Sold by
Not Provided
Bought by
Postreich Jeremy Nicholas and Postreich Sarah L
Create a Home Valuation Report for This Property
The Home Valuation Report is an in-depth analysis detailing your home's value as well as a comparison with similar homes in the area
Home Values in the Area
Average Home Value in this Area
Purchase History
| Date | Buyer | Sale Price | Title Company |
|---|---|---|---|
| Loyd Laquana N | -- | -- | |
| Loyd Laquana N | $220,000 | -- | |
| Postreich Jeremy Nicholas | $217,548 | -- | |
| Postreich Jeremy Nicholas | $1,801,440 | -- |
Source: Public Records
Mortgage History
| Date | Status | Borrower | Loan Amount |
|---|---|---|---|
| Previous Owner | Loyd Laquana N | $209,000 | |
| Previous Owner | Postreich Jeremy Nicholas | $188,151 |
Source: Public Records
Tax History Compared to Growth
Tax History
| Year | Tax Paid | Tax Assessment Tax Assessment Total Assessment is a certain percentage of the fair market value that is determined by local assessors to be the total taxable value of land and additions on the property. | Land | Improvement |
|---|---|---|---|---|
| 2025 | $2,874 | $139,000 | $24,000 | $115,000 |
| 2024 | $2,874 | $137,960 | $24,000 | $113,960 |
| 2023 | $2,209 | $110,960 | $12,160 | $98,800 |
| 2022 | $2,727 | $101,320 | $12,160 | $89,160 |
| 2021 | $2,755 | $88,040 | $12,160 | $75,880 |
| 2020 | $2,652 | $85,680 | $12,160 | $73,520 |
| 2019 | $2,652 | $84,280 | $12,160 | $72,120 |
| 2018 | $2,603 | $81,480 | $12,160 | $69,320 |
| 2017 | $2,434 | $81,840 | $12,160 | $69,680 |
| 2016 | $2,595 | $80,880 | $12,160 | $68,720 |
| 2015 | $2,635 | $81,720 | $12,160 | $69,560 |
| 2014 | $4,218 | $92,480 | $0 | $0 |
Source: Public Records
Map
Nearby Homes
- 7 Rolling Springs Ln
- 1335 Pine Barren Rd
- 322 Casey Dr
- 1726 Pine Barren Rd
- 227 Chippingwood Cir
- 1325 Pine Barren Rd
- 110 Coach House Square
- 100 Coach House Square
- 208 Chippingwood Cir
- 303 Morgan Pines Dr
- 405 Olde Ivey Square
- 300 Morgan Pines Dr
- 227 Standing Pine Cir
- 408 Old Ivy Square
- 1419 Pine Barren Rd
- 410 Old Ivy Square
- 505 Potter Stone Square
- 509 Potter Stone Square
- 511 Potter Stone Square
- 515 Potter Stone Square
- 169 Pine View Crossing
- 165 Pine View Crossing
- 163 Pine View Crossing
- 143 Somersby Blvd
- 220 Pine View Crossing
- 156 Pine View Crossing
- 161 Pine View Crossing
- 161 Pine View Crossing
- 154 Pine View Crossing
- 147 Somersby Blvd
- 159 Pine View Crossing
- 141 Somersby Blvd
- 149 Somersby Blvd
- 152 Pine View Crossing
- 140 Somersby Blvd
- 142 Somersby Blvd
- 144 Somersby Blvd
- 139 Somersby Blvd
- 146 Somersby Blvd
- 151 Somersby Blvd