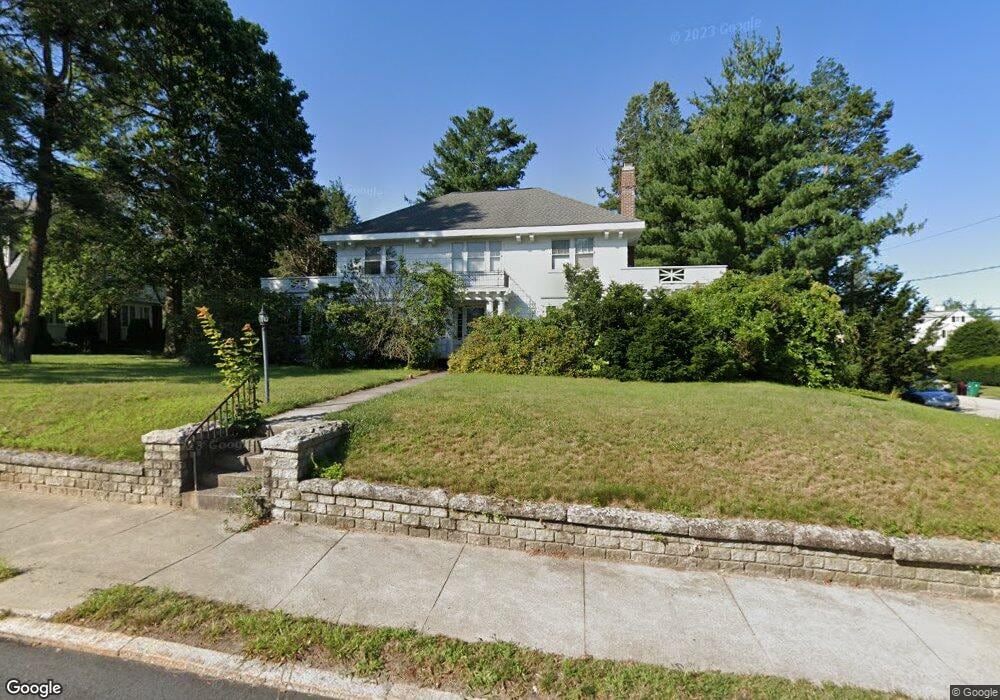
167 Woodland Rd Woonsocket, RI 02895
North End NeighborhoodEstimated Value: $528,476 - $578,000
4
Beds
5
Baths
3,067
Sq Ft
$179/Sq Ft
Est. Value
About This Home
This home is located at 167 Woodland Rd, Woonsocket, RI 02895 and is currently estimated at $550,369, approximately $179 per square foot. 167 Woodland Rd is a home located in Providence County with nearby schools including Woonsocket High School, Rise Prep Mayoral Academy Middle School, and Rise Prep Mayoral Academy.
Ownership History
Date
Name
Owned For
Owner Type
Purchase Details
Closed on
Sep 14, 2021
Sold by
Woonsocket City Of
Bought by
Reservoir Adventures Llc
Current Estimated Value
Purchase Details
Closed on
Oct 18, 2013
Sold by
Kelly John
Bought by
Ri Hsng Mtg & Fin Corp
Purchase Details
Closed on
Dec 29, 1999
Sold by
Plouffe John R and Hurley Maria A
Bought by
Kelly John R
Home Financials for this Owner
Home Financials are based on the most recent Mortgage that was taken out on this home.
Original Mortgage
$164,800
Interest Rate
7.71%
Mortgage Type
Purchase Money Mortgage
Purchase Details
Closed on
Sep 14, 1995
Sold by
Fitzgerald John G
Bought by
Plouffe John R
Create a Home Valuation Report for This Property
The Home Valuation Report is an in-depth analysis detailing your home's value as well as a comparison with similar homes in the area
Home Values in the Area
Average Home Value in this Area
Purchase History
We collect this data history from publicly available records. To have your information removed, we recommend requesting removal directly through your county’s website.
| Date | Buyer | Sale Price | Title Company |
|---|---|---|---|
| Reservoir Adventures Llc | $10,275 | None Available | |
| Reservoir Adventures Llc | $10,275 | None Available | |
| Reservoir Adventures Llc | $10,275 | None Available | |
| Ri Hsng Mtg & Fin Corp | $163 | -- | |
| Kelly John R | $206,000 | -- | |
| Plouffe John R | $172,000 | -- | |
| Ri Hsng Mtg & Fin Corp | $163 | -- | |
| Kelly John R | $206,000 | -- | |
| Plouffe John R | $172,000 | -- |
Source: Public Records
Mortgage History
We collect this data history from publicly available records. To have your information removed, we recommend requesting removal directly through your county’s website.
| Date | Status | Borrower | Loan Amount |
|---|---|---|---|
| Previous Owner | Plouffe John R | $164,800 | |
| Previous Owner | Plouffe John R | $25,000 |
Source: Public Records
Tax History
| Year | Tax Paid | Tax Assessment Tax Assessment Total Assessment is a certain percentage of the fair market value that is determined by local assessors to be the total taxable value of land and additions on the property. | Land | Improvement |
|---|---|---|---|---|
| 2025 | $5,721 | $509,400 | $127,700 | $381,700 |
| 2024 | $5,474 | $376,500 | $98,700 | $277,800 |
| 2023 | $5,263 | $376,500 | $98,700 | $277,800 |
| 2022 | $5,263 | $376,500 | $98,700 | $277,800 |
| 2021 | $5,657 | $238,200 | $76,400 | $161,800 |
| 2020 | $5,717 | $238,200 | $76,400 | $161,800 |
| 2018 | $5,736 | $238,200 | $76,400 | $161,800 |
| 2017 | $7,251 | $240,900 | $75,400 | $165,500 |
| 2016 | $7,670 | $240,900 | $75,400 | $165,500 |
| 2015 | $8,812 | $240,900 | $75,400 | $165,500 |
| 2014 | $5,874 | $233,500 | $83,100 | $150,400 |
Source: Public Records
Map
Nearby Homes
Your Personal Tour Guide
Ask me questions while you tour the home.