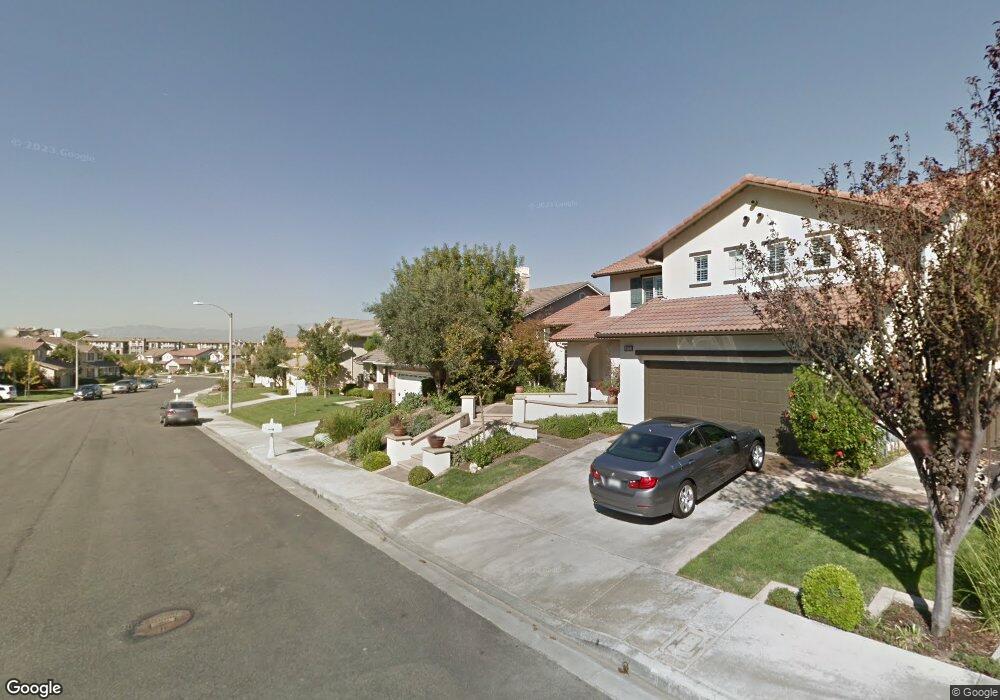
16705 Carob Ave Chino Hills, CA 91709
South Chino Hills NeighborhoodEstimated Value: $1,281,420 - $1,446,000
5
Beds
3
Baths
3,180
Sq Ft
$438/Sq Ft
Est. Value
About This Home
This home is located at 16705 Carob Ave, Chino Hills, CA 91709 and is currently estimated at $1,391,855, approximately $437 per square foot. 16705 Carob Ave is a home located in San Bernardino County with nearby schools including Michael G. Wickman Elementary School, Robert O. Townsend Junior High School, and Chino Hills High School.
Ownership History
Date
Name
Owned For
Owner Type
Purchase Details
Closed on
Mar 22, 2016
Sold by
Einspahr Harley R
Bought by
The Harley R Einspahr & Pamela L Einspah
Current Estimated Value
Home Financials for this Owner
Home Financials are based on the most recent Mortgage that was taken out on this home.
Original Mortgage
$231,500
Outstanding Balance
$99,972
Interest Rate
3.68%
Mortgage Type
New Conventional
Estimated Equity
$1,291,883
Purchase Details
Closed on
Jan 9, 2012
Sold by
Einspahr Harley R
Bought by
Einspahr Harley R and Einspahr Pamela L
Purchase Details
Closed on
Jul 9, 2003
Sold by
Standard Pacific Corp
Bought by
Einspahr Harley R and Einspahr Pamela L
Home Financials for this Owner
Home Financials are based on the most recent Mortgage that was taken out on this home.
Original Mortgage
$220,000
Interest Rate
5.6%
Mortgage Type
Purchase Money Mortgage
Create a Home Valuation Report for This Property
The Home Valuation Report is an in-depth analysis detailing your home's value as well as a comparison with similar homes in the area
Home Values in the Area
Average Home Value in this Area
Purchase History
| Date | Buyer | Sale Price | Title Company |
|---|---|---|---|
| The Harley R Einspahr & Pamela L Einspah | -- | Accommodation | |
| Einspahr Harley R | -- | Equity Title | |
| Einspahr Harley R | -- | None Available | |
| Einspahr Harley R | $559,500 | First American |
Source: Public Records
Mortgage History
| Date | Status | Borrower | Loan Amount |
|---|---|---|---|
| Open | Einspahr Harley R | $231,500 | |
| Previous Owner | Einspahr Harley R | $220,000 |
Source: Public Records
Tax History Compared to Growth
Tax History
| Year | Tax Paid | Tax Assessment Tax Assessment Total Assessment is a certain percentage of the fair market value that is determined by local assessors to be the total taxable value of land and additions on the property. | Land | Improvement |
|---|---|---|---|---|
| 2025 | $10,521 | $809,190 | $198,748 | $610,442 |
| 2024 | $10,521 | $793,324 | $194,851 | $598,473 |
| 2023 | $10,243 | $777,768 | $191,030 | $586,738 |
| 2022 | $10,156 | $762,517 | $187,284 | $575,233 |
| 2021 | $9,957 | $747,566 | $183,612 | $563,954 |
| 2020 | $9,815 | $739,900 | $181,729 | $558,171 |
| 2019 | $9,730 | $725,392 | $178,166 | $547,226 |
| 2018 | $9,545 | $711,169 | $174,673 | $536,496 |
| 2017 | $9,387 | $697,224 | $171,248 | $525,976 |
| 2016 | $8,729 | $671,553 | $167,890 | $503,663 |
| 2015 | $8,567 | $661,466 | $165,368 | $496,098 |
| 2014 | $8,411 | $648,509 | $162,129 | $486,380 |
Source: Public Records
Map
Nearby Homes
- 16631 Sagebrush St
- 16629 Quail Country Ave
- 16848 Morning Glory Ct
- 5514 Lisboa St
- 5185 Highview St
- 16694 Tourmaline St
- 5176 Glenview St
- 16731 Swift Fox Ave
- 16675 Bear Creek Ave
- 17004 Viana Dr
- 16433 Garnet Way
- 17065 Branco Dr
- 17028 Barcelos Dr
- 4936 Highview St
- 4949 Highview St
- 5142 Cellini Dr
- 17204 Guarda Dr
- 17185 Guarda Dr
- 5521 Stargaze St
- 16410 Argent Rd
- 16697 Carob Ave
- 16713 Carob Ave
- 16686 Sagebrush St
- 16689 Carob Ave
- 16678 Sagebrush St
- 16721 Carob Ave
- 16694 Sagebrush St
- 16702 Sagebrush St
- 16670 Sagebrush St
- 16714 Carob Ave
- 16681 Carob Ave
- 16704 Carob Ave
- 16729 Carob Ave
- 16724 Carob Ave
- 16696 Carob Ave
- 16710 Sagebrush St
- 16658 Sagebrush St
- 16688 Carob Ave
- 16734 Carob Ave
- 16680 Carob Ave