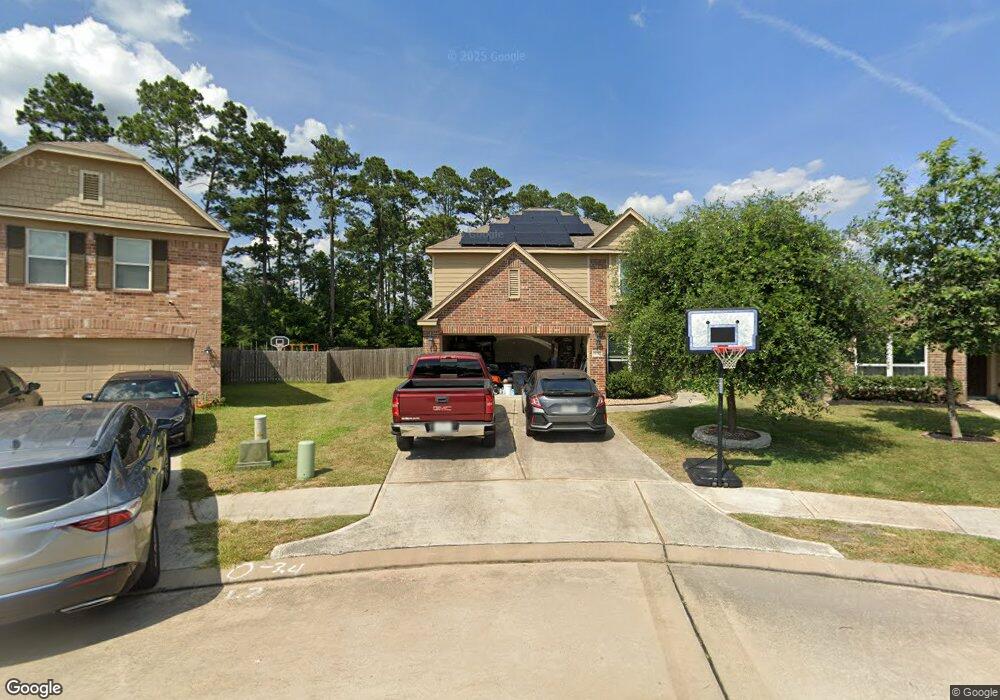
16707 Lark Bunting Ln Conroe, TX 77385
Estimated Value: $299,211 - $362,000
--
Bed
1
Bath
2,572
Sq Ft
$126/Sq Ft
Est. Value
About This Home
This home is located at 16707 Lark Bunting Ln, Conroe, TX 77385 and is currently estimated at $325,053, approximately $126 per square foot. 16707 Lark Bunting Ln is a home with nearby schools including Suchma Elementary School, Irons J High School, and Oak Ridge High School.
Ownership History
Date
Name
Owned For
Owner Type
Purchase Details
Closed on
Oct 14, 2021
Sold by
Friess Paul Michael and Friess Colleen Anne
Bought by
Friess Paul Michael and Friess Colleen Anne
Current Estimated Value
Purchase Details
Closed on
Jun 14, 2016
Sold by
Long Lake Ltd
Bought by
Friess Colleen Anne and Friess Paul Michael
Home Financials for this Owner
Home Financials are based on the most recent Mortgage that was taken out on this home.
Original Mortgage
$206,431
Outstanding Balance
$164,510
Interest Rate
3.61%
Mortgage Type
FHA
Estimated Equity
$160,543
Purchase Details
Closed on
Apr 22, 2016
Sold by
Woodmere Development Co Ltd
Bought by
Friess Paul M and Friess Colleen A
Home Financials for this Owner
Home Financials are based on the most recent Mortgage that was taken out on this home.
Original Mortgage
$206,431
Outstanding Balance
$164,510
Interest Rate
3.61%
Mortgage Type
FHA
Estimated Equity
$160,543
Create a Home Valuation Report for This Property
The Home Valuation Report is an in-depth analysis detailing your home's value as well as a comparison with similar homes in the area
Home Values in the Area
Average Home Value in this Area
Purchase History
| Date | Buyer | Sale Price | Title Company |
|---|---|---|---|
| Friess Paul Michael | -- | None Available | |
| Friess Colleen Anne | -- | South Land Title Llc | |
| Friess Paul M | -- | -- |
Source: Public Records
Mortgage History
| Date | Status | Borrower | Loan Amount |
|---|---|---|---|
| Open | Friess Colleen Anne | $206,431 |
Source: Public Records
Tax History Compared to Growth
Tax History
| Year | Tax Paid | Tax Assessment Tax Assessment Total Assessment is a certain percentage of the fair market value that is determined by local assessors to be the total taxable value of land and additions on the property. | Land | Improvement |
|---|---|---|---|---|
| 2025 | $5,446 | $333,663 | $42,075 | $291,588 |
| 2024 | $4,861 | $319,924 | -- | -- |
| 2023 | $4,861 | $290,840 | $42,080 | $294,720 |
| 2022 | $6,315 | $307,860 | $42,080 | $265,780 |
| 2021 | $6,271 | $240,360 | $42,080 | $198,280 |
| 2020 | $6,325 | $229,340 | $56,080 | $202,330 |
| 2019 | $6,014 | $208,490 | $14,250 | $196,390 |
| 2018 | $4,612 | $189,540 | $14,250 | $175,290 |
| 2017 | $5,570 | $189,540 | $14,250 | $175,290 |
| 2016 | $259 | $8,830 | $8,830 | $0 |
Source: Public Records
Map
Nearby Homes
- 10311 Woodhollow Dr
- 10114 N Whimbrel Cir
- 10003 S Whimbrel Cir
- 3420 Chestnut Colony Ct
- 16774 Fallen Timbers Dr
- 9977 Western Ridge Way
- 16751 N Rail Dr
- 16778 N Gull Dr
- 9972 Western Ridge Way
- 16771 N Rail Dr
- 9877 Lace Flower Way
- 16373 Olive Sparrow Dr
- 11008 Redbud Dr
- 00 Redbud Dr
- 12 Redbud Dr
- 0 Redbud Dr
- 10 Redbud Dr
- 9976 Cassowary Dr
- 9921 Kingfisher Dr
- 9838 Bobolink Dr
- 16711 Lark Bunting Ln
- 16703 Lark Bunting Ln
- 16715 Lark Bunting Ln
- 16702 Lark Bunting Ln
- 16719 Lark Bunting Ln
- 16723 Lark Bunting Ln
- 16710 Lark Bunting Ln
- 16714 Lark Bunting Ln
- 16706 Lark Bunting Ln
- 16727 Lark Bunting Ln
- 9949 Swallow Dr
- 9960 Swallow Dr
- 16731 Lark Bunting Ln
- 10298 Woodhollow Dr
- 9956 Swallow Dr
- 10320 Woodhollow Dr
- 9945 Swallow Dr
- 9952 Swallow Dr
- 10292 Woodhollow Dr
- 9971 Chimney Swift Ln