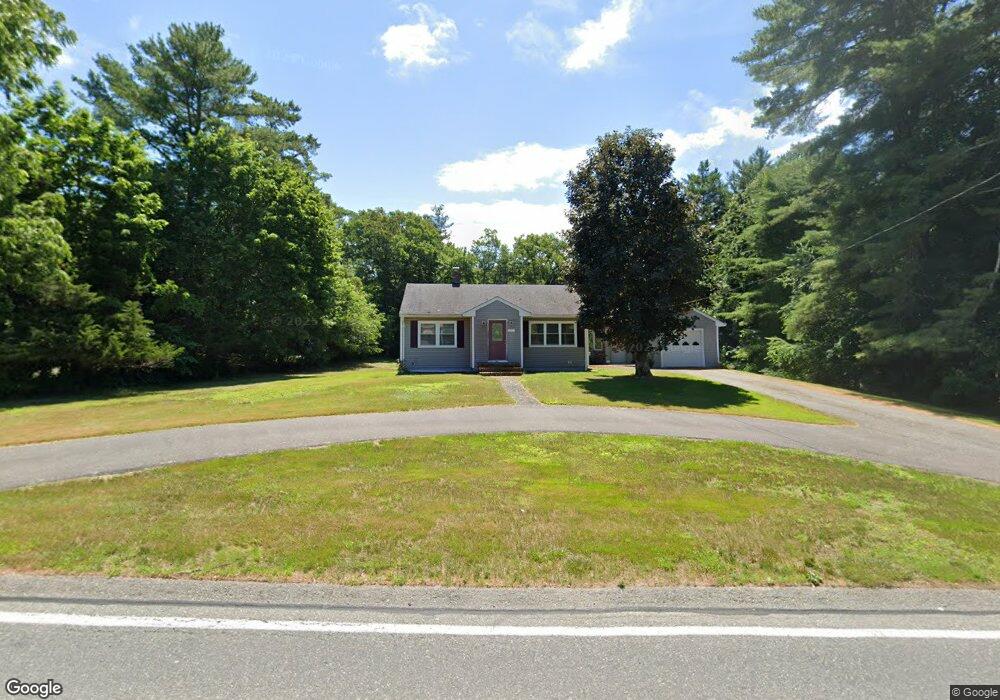
1671 Central St East Bridgewater, MA 02333
Estimated Value: $428,000 - $509,000
2
Beds
1
Bath
1,100
Sq Ft
$417/Sq Ft
Est. Value
About This Home
This home is located at 1671 Central St, East Bridgewater, MA 02333 and is currently estimated at $458,786, approximately $417 per square foot. 1671 Central St is a home located in Plymouth County with nearby schools including Central Elementary School, Gordon W Mitchell Middle School, and East Bridgewater Jr./Sr. High School.
Ownership History
Date
Name
Owned For
Owner Type
Purchase Details
Closed on
Apr 22, 2010
Sold by
Warder Shannon L and Brennan Richard K
Bought by
Manganiello Ernest S
Current Estimated Value
Home Financials for this Owner
Home Financials are based on the most recent Mortgage that was taken out on this home.
Original Mortgage
$221,950
Outstanding Balance
$147,826
Interest Rate
5%
Mortgage Type
Purchase Money Mortgage
Estimated Equity
$310,960
Create a Home Valuation Report for This Property
The Home Valuation Report is an in-depth analysis detailing your home's value as well as a comparison with similar homes in the area
Home Values in the Area
Average Home Value in this Area
Purchase History
| Date | Buyer | Sale Price | Title Company |
|---|---|---|---|
| Manganiello Ernest S | $230,000 | -- |
Source: Public Records
Mortgage History
| Date | Status | Borrower | Loan Amount |
|---|---|---|---|
| Open | Manganiello Ernest S | $221,950 |
Source: Public Records
Tax History Compared to Growth
Tax History
| Year | Tax Paid | Tax Assessment Tax Assessment Total Assessment is a certain percentage of the fair market value that is determined by local assessors to be the total taxable value of land and additions on the property. | Land | Improvement |
|---|---|---|---|---|
| 2025 | $4,635 | $339,100 | $187,800 | $151,300 |
| 2024 | $4,599 | $332,300 | $180,600 | $151,700 |
| 2023 | $4,666 | $322,900 | $180,600 | $142,300 |
| 2022 | $4,686 | $300,400 | $164,300 | $136,100 |
| 2021 | $5,080 | $272,900 | $157,900 | $115,000 |
| 2020 | $4,971 | $264,400 | $151,800 | $112,600 |
| 2019 | $4,469 | $254,500 | $145,100 | $109,400 |
| 2018 | $4,273 | $237,900 | $145,100 | $92,800 |
| 2017 | $16,084 | $228,400 | $138,400 | $90,000 |
| 2016 | $4,113 | $226,500 | $138,300 | $88,200 |
| 2015 | $4,028 | $226,800 | $137,400 | $89,400 |
| 2014 | $3,915 | $225,400 | $134,500 | $90,900 |
Source: Public Records
Map
Nearby Homes
- 9 Daisy Ln
- 5 Della Way
- 844 Washington St
- 1247 Central St
- 936 Central St
- 1 Simmons Place
- 80 Phillips St
- 14 Mountain Ash Rd
- 72 Phillips St
- 170 Elm St
- 9 Hemlock Dr
- 521 Franklin St
- 572 Harvard St
- 182 Crystal Water Dr Unit 182
- 217 Crystal Water Dr
- 84 Washington St
- 78 Crystal Water Dr
- 28 Brookbend Way E
- 125 Independence Ave
- 1054 Main St