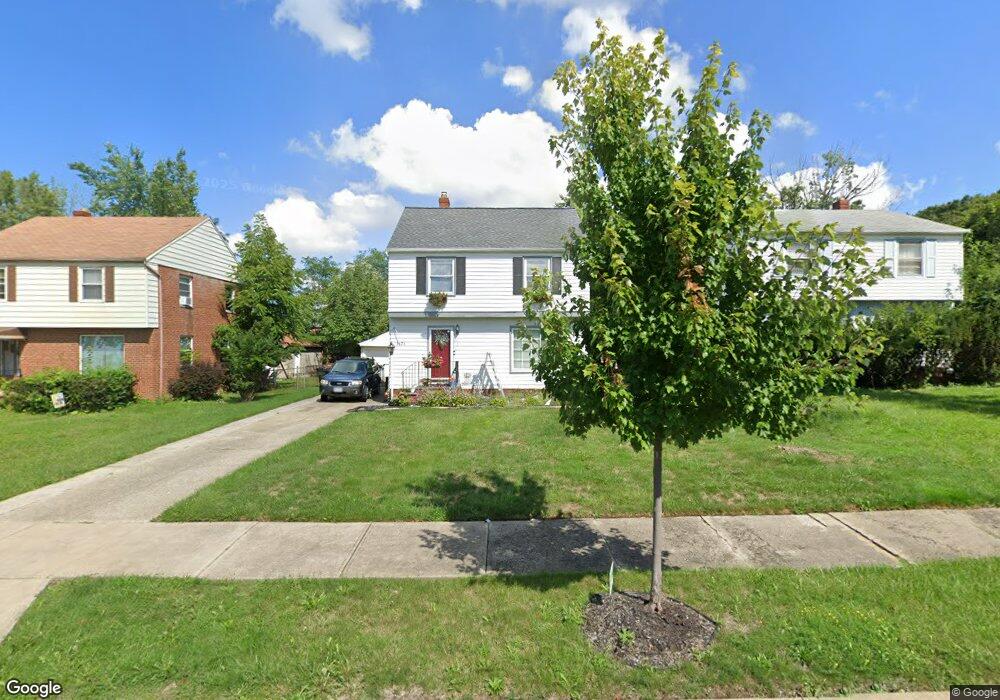
1671 E 276th St Euclid, OH 44132
Estimated Value: $122,826 - $141,000
3
Beds
2
Baths
1,544
Sq Ft
$85/Sq Ft
Est. Value
About This Home
This home is located at 1671 E 276th St, Euclid, OH 44132 and is currently estimated at $130,957, approximately $84 per square foot. 1671 E 276th St is a home located in Cuyahoga County with nearby schools including Bluestone Elementary School, Euclid High School, and All Saints of St. John Vianney School.
Ownership History
Date
Name
Owned For
Owner Type
Purchase Details
Closed on
Apr 21, 2006
Sold by
Federal Home Loan Mortgage Corporation
Bought by
Sims Kimberly
Current Estimated Value
Home Financials for this Owner
Home Financials are based on the most recent Mortgage that was taken out on this home.
Original Mortgage
$89,900
Interest Rate
6.66%
Mortgage Type
Fannie Mae Freddie Mac
Purchase Details
Closed on
Nov 3, 2005
Sold by
Rand William C and Freedom Mortgage Corp
Bought by
Federal Home Loan Mortgage Corporation
Purchase Details
Closed on
Apr 12, 1989
Sold by
Tomba Joseph A and Tomba Deborah P
Bought by
Duncan Rickey W
Purchase Details
Closed on
Dec 30, 1975
Sold by
Spilar A A and S A
Bought by
Tomba Joseph A and Tomba Deborah P
Purchase Details
Closed on
Jan 1, 1975
Bought by
Spilar A A and S A
Create a Home Valuation Report for This Property
The Home Valuation Report is an in-depth analysis detailing your home's value as well as a comparison with similar homes in the area
Home Values in the Area
Average Home Value in this Area
Purchase History
| Date | Buyer | Sale Price | Title Company |
|---|---|---|---|
| Sims Kimberly | -- | Attorney | |
| Federal Home Loan Mortgage Corporation | $65,000 | Attorney | |
| Duncan Rickey W | $65,300 | -- | |
| Tomba Joseph A | $38,000 | -- | |
| Spilar A A | -- | -- |
Source: Public Records
Mortgage History
| Date | Status | Borrower | Loan Amount |
|---|---|---|---|
| Previous Owner | Sims Kimberly | $89,900 |
Source: Public Records
Tax History
| Year | Tax Paid | Tax Assessment Tax Assessment Total Assessment is a certain percentage of the fair market value that is determined by local assessors to be the total taxable value of land and additions on the property. | Land | Improvement |
|---|---|---|---|---|
| 2025 | $2,157 | $31,710 | $7,245 | $24,465 |
| 2024 | $2,225 | $31,710 | $7,245 | $24,465 |
| 2023 | $1,962 | $22,160 | $5,600 | $16,560 |
| 2022 | $1,918 | $22,160 | $5,600 | $16,560 |
| 2021 | $2,128 | $22,160 | $5,600 | $16,560 |
| 2020 | $1,793 | $16,770 | $4,240 | $12,530 |
| 2019 | $1,608 | $47,900 | $12,100 | $35,800 |
| 2018 | $1,562 | $16,770 | $4,240 | $12,530 |
| 2017 | $1,621 | $13,970 | $3,500 | $10,470 |
| 2016 | $1,625 | $13,970 | $3,500 | $10,470 |
| 2015 | $1,724 | $13,970 | $3,500 | $10,470 |
| 2014 | $1,724 | $16,420 | $4,130 | $12,290 |
Source: Public Records
Map
Nearby Homes
- 1670 Hillandale Dr
- 127 Brush Rd
- 28855 Hazel Ave
- 28900 Euclid Ave
- 145 Richmond Rd
- 2715 Cabin Dr
- 1471 Hall Ct
- 28755 Chardon Rd
- V/L 39 Chardon Rd
- 1530 E 254th St
- 1437 E 252nd St
- 815 E 272nd St
- 1552 E 254th St
- 2919 Emerald Lakes Blvd
- 890 E 250th St
- 795 E 260th St
- 25161 Euclid Ave
- 730 Hemlock Dr
- 1790 Skyline Dr
- 1807 Skyline Dr
- 1665 E 276th St
- 1675 E 276th St
- 1661 E 276th St
- 1680 Hillandale Dr
- 1655 E 276th St
- 1664 Hillandale Dr
- 1674 E 276th St
- 1670 E 276th St
- 1664 E 276th St
- 1664 E 276th St Unit E
- 1651 E 276th St
- 1660 Hillandale Dr
- 1680 E 276th St
- 1660 E 276th St
- 27640 Tremaine Dr
- 27610 Tremaine Dr
- 1654 Hillandale Dr
- 27772 Tremaine Dr
- 27600 Tremaine Dr
- 1641 E 276th St
Your Personal Tour Guide
Ask me questions while you tour the home.