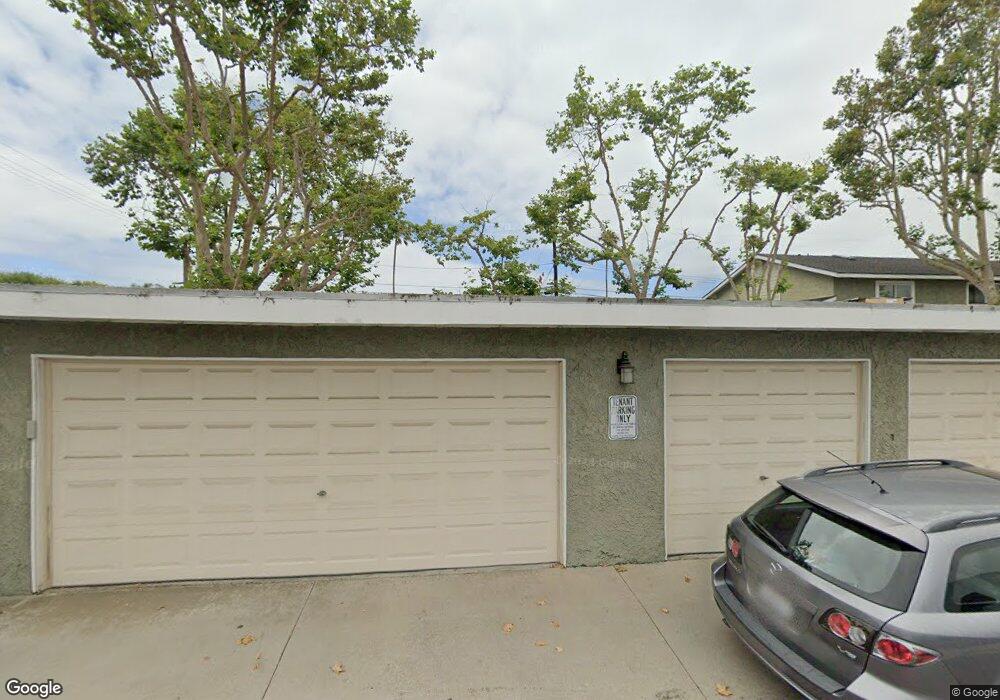
1671 Tustin Ave Unit B1 Costa Mesa, CA 92627
Downtown Costa Mesa NeighborhoodEstimated Value: $960,000 - $1,336,000
3
Beds
2
Baths
1,401
Sq Ft
$815/Sq Ft
Est. Value
About This Home
This home is located at 1671 Tustin Ave Unit B1, Costa Mesa, CA 92627 and is currently estimated at $1,141,628, approximately $814 per square foot. 1671 Tustin Ave Unit B1 is a home located in Orange County with nearby schools including Newport Heights Elementary, Horace Ensign Intermediate School, and Newport Harbor High School.
Ownership History
Date
Name
Owned For
Owner Type
Purchase Details
Closed on
May 23, 2018
Sold by
Rathsack Mark Edward
Bought by
Rathsack Edward and Rathsack Alessandra
Current Estimated Value
Purchase Details
Closed on
Apr 13, 1999
Sold by
Rathsack Mark and Rathsack Mark E
Bought by
Rathsack Mark
Home Financials for this Owner
Home Financials are based on the most recent Mortgage that was taken out on this home.
Original Mortgage
$150,000
Outstanding Balance
$37,983
Interest Rate
7.04%
Estimated Equity
$1,103,645
Purchase Details
Closed on
Jan 9, 1996
Sold by
Giordano Alessandra
Bought by
Rathsack Mark E
Home Financials for this Owner
Home Financials are based on the most recent Mortgage that was taken out on this home.
Original Mortgage
$139,600
Interest Rate
7.38%
Purchase Details
Closed on
Dec 8, 1995
Sold by
Sears Pamela Sue
Bought by
Rathsack Mark E
Home Financials for this Owner
Home Financials are based on the most recent Mortgage that was taken out on this home.
Original Mortgage
$139,600
Interest Rate
7.38%
Create a Home Valuation Report for This Property
The Home Valuation Report is an in-depth analysis detailing your home's value as well as a comparison with similar homes in the area
Home Values in the Area
Average Home Value in this Area
Purchase History
| Date | Buyer | Sale Price | Title Company |
|---|---|---|---|
| Rathsack Edward | -- | None Available | |
| Rathsack Mark | -- | United Title Company | |
| Rathsack Mark E | -- | American Title Ins Co | |
| Rathsack Mark E | $174,000 | American Title Ins Co |
Source: Public Records
Mortgage History
| Date | Status | Borrower | Loan Amount |
|---|---|---|---|
| Open | Rathsack Mark | $150,000 | |
| Closed | Rathsack Mark E | $139,600 |
Source: Public Records
Tax History Compared to Growth
Tax History
| Year | Tax Paid | Tax Assessment Tax Assessment Total Assessment is a certain percentage of the fair market value that is determined by local assessors to be the total taxable value of land and additions on the property. | Land | Improvement |
|---|---|---|---|---|
| 2025 | $3,613 | $289,878 | $158,144 | $131,734 |
| 2024 | $3,613 | $284,195 | $155,044 | $129,151 |
| 2023 | $3,486 | $278,623 | $152,004 | $126,619 |
| 2022 | $3,320 | $273,160 | $149,023 | $124,137 |
| 2021 | $3,196 | $267,804 | $146,101 | $121,703 |
| 2020 | $3,165 | $265,058 | $144,602 | $120,456 |
| 2019 | $3,107 | $259,861 | $141,766 | $118,095 |
| 2018 | $3,048 | $254,766 | $138,986 | $115,780 |
| 2017 | $2,996 | $249,771 | $136,261 | $113,510 |
| 2016 | $2,931 | $244,874 | $133,589 | $111,285 |
| 2015 | $2,899 | $241,196 | $131,582 | $109,614 |
| 2014 | $2,795 | $236,472 | $129,005 | $107,467 |
Source: Public Records
Map
Nearby Homes
- 411 Lenwood Dr
- 1596 Riverside Place
- 1594 Redlands Place
- 496 E 16th St
- 2217 Laurel Place
- 387 La Perle Place
- 2300 Margaret Dr
- 600 Powell Place
- 1800 Westcliff Dr
- 418 Broadway
- 268 E 18th St
- 245 Palmer St
- 225 Knox St
- 1008 Buckingham Ln Unit 17
- 1705 Haven Place Unit 1
- 510 Catalina Dr
- 308 Flower St
- 430 Aliso Ave
- 516 Bolsa Ave
- 465 Santa Ana Ave
- 1671 Tustin Ave Unit B3
- 1671 Tustin Ave Unit c3
- 1671 Tustin Ave Unit 3C
- 1671 Tustin Ave Unit 3
- 1671 Tustin Ave Unit 1
- 1671 Tustin Ave
- 1671 Tustin Ave Unit A1
- 1671 Tustin Ave Unit 2
- 1671 Tustin Ave Unit 6
- 1671 Tustin Ave Unit 7
- 1671 Tustin Ave Unit 5
- 1671 Tustin Ave Unit C4
- 1671 Tustin Ave Unit C2
- 1671 Tustin Ave Unit C1
- 1671 Tustin Ave Unit 8
- 1644 Tustin Ave
- 1644 Tustin Ave
- 1670 Tustin Ave
- 1666 Tustin Ave
- 1654 Tustin Ave