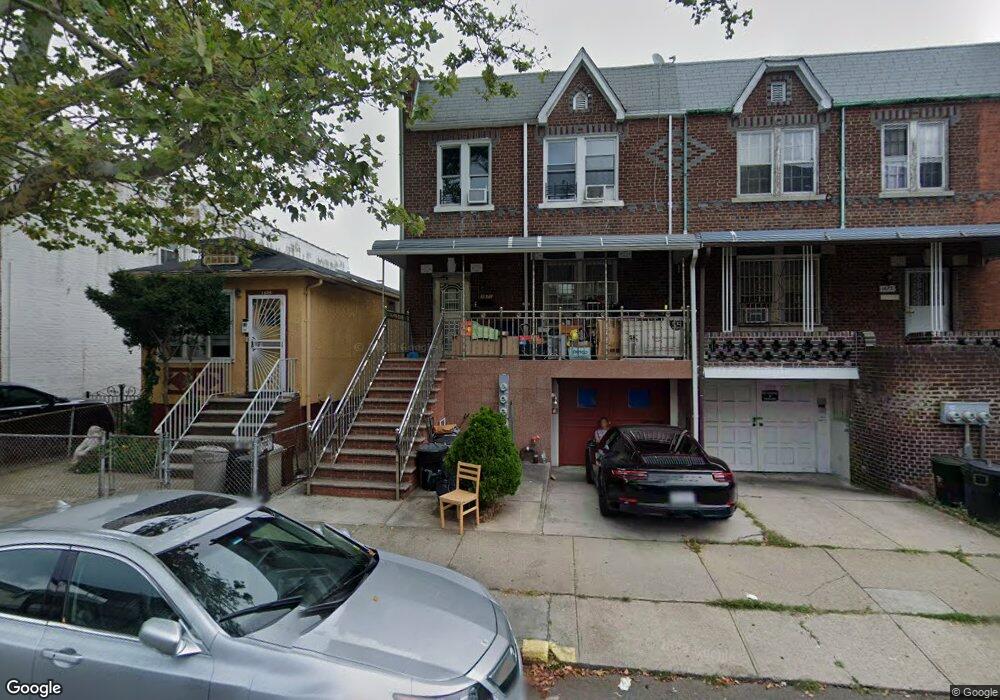
1671 W 8th St Brooklyn, NY 11223
Gravesend NeighborhoodEstimated Value: $1,475,000 - $1,633,000
--
Bed
--
Bath
2,676
Sq Ft
$572/Sq Ft
Est. Value
About This Home
This home is located at 1671 W 8th St, Brooklyn, NY 11223 and is currently estimated at $1,530,008, approximately $571 per square foot. 1671 W 8th St is a home located in Kings County with nearby schools including P.S.177 The Marlboro, Seth Low Intermediate School 96, and James Madison High School.
Ownership History
Date
Name
Owned For
Owner Type
Purchase Details
Closed on
Dec 23, 2014
Sold by
Choi Jess Sukchu
Bought by
Jiang Chun Sheng and Wang Cui Ping
Current Estimated Value
Purchase Details
Closed on
Jan 9, 2012
Sold by
Choi Jess S and Leon-So Joaquin M
Bought by
Choi Jess Sukchu
Purchase Details
Closed on
Aug 20, 2007
Sold by
Chovnick Gary and Chovnick Pearl
Bought by
Choi Jess S and Leon-So Joaquin M
Home Financials for this Owner
Home Financials are based on the most recent Mortgage that was taken out on this home.
Original Mortgage
$487,500
Interest Rate
6.74%
Mortgage Type
Purchase Money Mortgage
Purchase Details
Closed on
Sep 13, 2000
Sold by
Chovnick Pearl
Bought by
Chovnick Pearl and Finn Carol
Purchase Details
Closed on
Apr 12, 1994
Sold by
Chovnick Reuben
Bought by
Chovnick Pearl
Create a Home Valuation Report for This Property
The Home Valuation Report is an in-depth analysis detailing your home's value as well as a comparison with similar homes in the area
Home Values in the Area
Average Home Value in this Area
Purchase History
| Date | Buyer | Sale Price | Title Company |
|---|---|---|---|
| Jiang Chun Sheng | $930,000 | -- | |
| Jiang Chun Sheng | $930,000 | -- | |
| Choi Jess Sukchu | -- | -- | |
| Choi Jess Sukchu | -- | -- | |
| Choi Jess S | $650,000 | -- | |
| Choi Jess S | $650,000 | -- | |
| Chovnick Pearl | -- | -- | |
| Chovnick Pearl | -- | -- | |
| Chovnick Pearl | -- | First American Title Ins Co | |
| Chovnick Pearl | -- | First American Title Ins Co |
Source: Public Records
Mortgage History
| Date | Status | Borrower | Loan Amount |
|---|---|---|---|
| Previous Owner | Choi Jess S | $487,500 |
Source: Public Records
Tax History Compared to Growth
Tax History
| Year | Tax Paid | Tax Assessment Tax Assessment Total Assessment is a certain percentage of the fair market value that is determined by local assessors to be the total taxable value of land and additions on the property. | Land | Improvement |
|---|---|---|---|---|
| 2025 | $9,238 | $96,360 | $13,260 | $83,100 |
| 2024 | $9,238 | $84,240 | $13,260 | $70,980 |
| 2023 | $8,813 | $87,240 | $13,260 | $73,980 |
| 2022 | $8,424 | $92,220 | $13,260 | $78,960 |
| 2021 | $8,881 | $87,780 | $13,260 | $74,520 |
| 2020 | $4,251 | $83,580 | $13,260 | $70,320 |
| 2019 | $8,018 | $83,580 | $13,260 | $70,320 |
| 2018 | $7,372 | $36,162 | $6,919 | $29,243 |
| 2017 | $7,169 | $35,167 | $7,553 | $27,614 |
| 2016 | $7,030 | $35,167 | $8,411 | $26,756 |
| 2015 | $3,782 | $33,858 | $10,043 | $23,815 |
| 2014 | $3,782 | $31,942 | $10,547 | $21,395 |
Source: Public Records
Map
Nearby Homes
- 1664 W 8th St
- 133 Quentin Rd
- 1639 W 9th St
- 1623 W 8th St
- 1683 W 7th St Unit 2A
- 1683 W 7th St Unit 3A
- 1683 W 7th St Unit 4B
- 1683 W 7th St Unit 3B
- 1683 W 7th St Unit 2B
- 1683 W 7th St Unit 5-B
- 103 Quentin Rd Unit B503
- 1641 W 6th St
- 226 Kings Hwy
- 290 Kings Hwy
- 157 Avenue P Unit 2A
- 1721 W 6th St Unit 2A
- 86 Quentin Rd
- 248 Avenue P
- 1569 W 7th St Unit 3B
- 1569 W 7th St Unit 1A