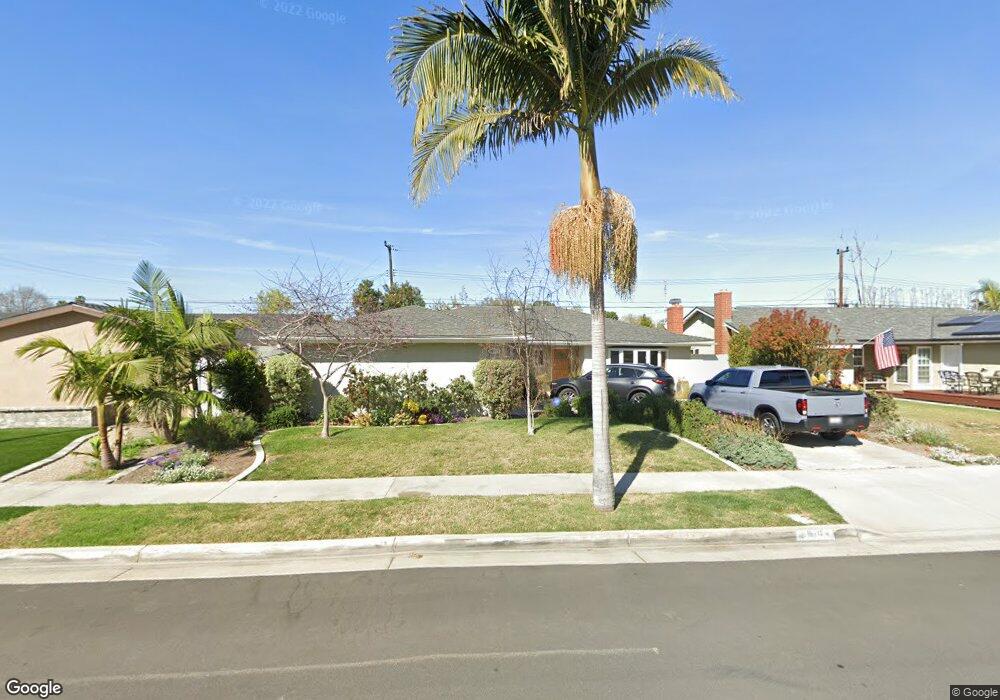
16711 Marie Ln Huntington Beach, CA 92647
Estimated Value: $1,198,718 - $1,481,000
4
Beds
2
Baths
1,615
Sq Ft
$802/Sq Ft
Est. Value
About This Home
This home is located at 16711 Marie Ln, Huntington Beach, CA 92647 and is currently estimated at $1,294,430, approximately $801 per square foot. 16711 Marie Ln is a home located in Orange County with nearby schools including College View Elementary School, Spring View Middle School, and Ocean View High.
Ownership History
Date
Name
Owned For
Owner Type
Purchase Details
Closed on
May 24, 2013
Sold by
Colangelo Ronald B and Colangelo Shelley J
Bought by
Colangelo Ronald B and Colangelo Shelley J
Current Estimated Value
Purchase Details
Closed on
Jul 18, 2001
Sold by
Colangelo Ronald B
Bought by
Colangelo Ronald B and Colangelo Shelley
Home Financials for this Owner
Home Financials are based on the most recent Mortgage that was taken out on this home.
Original Mortgage
$240,000
Outstanding Balance
$92,221
Interest Rate
7.1%
Estimated Equity
$1,202,209
Purchase Details
Closed on
Aug 20, 1999
Sold by
Neilson John A and Neilson Marian J
Bought by
Colangelo Ronald B
Home Financials for this Owner
Home Financials are based on the most recent Mortgage that was taken out on this home.
Original Mortgage
$240,000
Interest Rate
7.97%
Create a Home Valuation Report for This Property
The Home Valuation Report is an in-depth analysis detailing your home's value as well as a comparison with similar homes in the area
Home Values in the Area
Average Home Value in this Area
Purchase History
| Date | Buyer | Sale Price | Title Company |
|---|---|---|---|
| Colangelo Ronald B | -- | None Available | |
| Colangelo Ronald B | -- | Commonwealth Land Title | |
| Colangelo Ronald B | $269,000 | Orange Coast Title |
Source: Public Records
Mortgage History
| Date | Status | Borrower | Loan Amount |
|---|---|---|---|
| Open | Colangelo Ronald B | $240,000 | |
| Closed | Colangelo Ronald B | $240,000 |
Source: Public Records
Tax History Compared to Growth
Tax History
| Year | Tax Paid | Tax Assessment Tax Assessment Total Assessment is a certain percentage of the fair market value that is determined by local assessors to be the total taxable value of land and additions on the property. | Land | Improvement |
|---|---|---|---|---|
| 2025 | $4,997 | $436,094 | $318,087 | $118,007 |
| 2024 | $4,997 | $427,544 | $311,850 | $115,694 |
| 2023 | $4,882 | $419,161 | $305,735 | $113,426 |
| 2022 | $4,807 | $410,943 | $299,741 | $111,202 |
| 2021 | $4,718 | $402,886 | $293,864 | $109,022 |
| 2020 | $4,665 | $398,755 | $290,850 | $107,905 |
| 2019 | $4,585 | $390,937 | $285,147 | $105,790 |
| 2018 | $4,482 | $383,272 | $279,556 | $103,716 |
| 2017 | $4,410 | $375,757 | $274,074 | $101,683 |
| 2016 | $4,177 | $363,323 | $268,700 | $94,623 |
| 2015 | $4,112 | $357,866 | $264,664 | $93,202 |
| 2014 | $4,030 | $350,856 | $259,479 | $91,377 |
Source: Public Records
Map
Nearby Homes
- 16722 Goldenwest St
- 16531 Sabot Ln
- 16542 Sabot Ln
- 16892 Limelight Cir Unit B
- 7002 Valentine Dr
- 16401 Serenade Ln
- 6672 Sun Dr Unit B
- 16381 Magellan Ln
- 7252 Elk Cir
- 7248 Aura Cir
- 7252 Ellington Dr
- 7231 Alchemy Cir
- 7223 Alchemy Cir
- 7264 Aura Cir
- 7272 Ellington Dr
- 6600 Warner Ave Unit 50
- 6600 Warner Ave
- 6351 Gloria Dr
- 17261 Gothard St Unit 60
- 17261 Gothard St Unit 50
- 16701 Marie Ln
- 16721 Marie Ln
- 16712 Kettler Ln
- 16702 Kettler Ln
- 16691 Marie Ln
- 16731 Marie Ln
- 6911 Carla Cir
- 16692 Kettler Ln
- 16732 Kettler Ln
- 16681 Marie Ln
- 6912 Carla Cir
- 16741 Marie Ln
- 16682 Kettler Ln
- 6912 Paula Cir
- 6921 Carla Cir
- 6852 Sylvia Dr
- 16742 Wanda Cir
- 6922 Carla Cir
- 16661 Marie Ln
- 16752 Wanda Cir