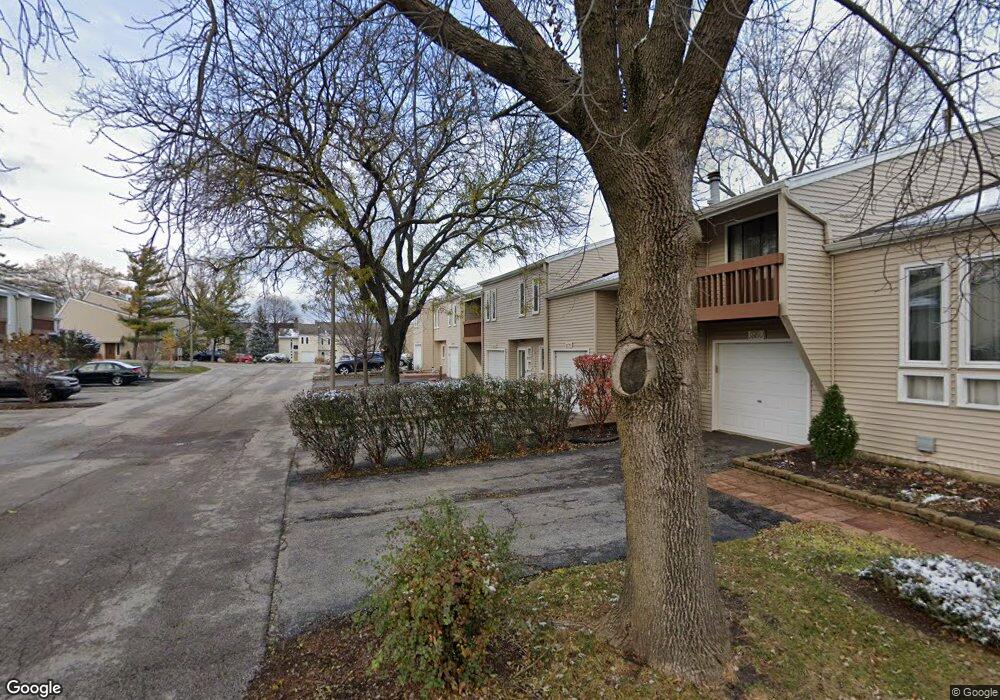
1672 Cove Ct Unit 2 Naperville, IL 60565
Meadow Glens NeighborhoodEstimated Value: $315,629 - $356,000
--
Bed
1
Bath
1,328
Sq Ft
$252/Sq Ft
Est. Value
About This Home
This home is located at 1672 Cove Ct Unit 2, Naperville, IL 60565 and is currently estimated at $334,157, approximately $251 per square foot. 1672 Cove Ct Unit 2 is a home located in DuPage County with nearby schools including Maplebrook Elementary School, Lincoln Jr. High School, and Naperville Central High School.
Ownership History
Date
Name
Owned For
Owner Type
Purchase Details
Closed on
Jun 14, 2002
Sold by
Becola John P and Taubery Patricia
Bought by
Milord Richard
Current Estimated Value
Home Financials for this Owner
Home Financials are based on the most recent Mortgage that was taken out on this home.
Original Mortgage
$138,150
Outstanding Balance
$58,661
Interest Rate
6.87%
Estimated Equity
$275,496
Purchase Details
Closed on
Aug 25, 1997
Sold by
Becola John P
Bought by
Becola John P and Taubery Patricia
Purchase Details
Closed on
May 12, 1997
Sold by
Haines Clifford T and Rus Pamela M
Bought by
Becola John P
Home Financials for this Owner
Home Financials are based on the most recent Mortgage that was taken out on this home.
Original Mortgage
$114,000
Interest Rate
8.27%
Create a Home Valuation Report for This Property
The Home Valuation Report is an in-depth analysis detailing your home's value as well as a comparison with similar homes in the area
Home Values in the Area
Average Home Value in this Area
Purchase History
| Date | Buyer | Sale Price | Title Company |
|---|---|---|---|
| Milord Richard | $153,500 | -- | |
| Becola John P | -- | -- | |
| Becola John P | $120,000 | Law Title Pick Up |
Source: Public Records
Mortgage History
| Date | Status | Borrower | Loan Amount |
|---|---|---|---|
| Open | Milord Richard | $138,150 | |
| Previous Owner | Becola John P | $114,000 |
Source: Public Records
Tax History Compared to Growth
Tax History
| Year | Tax Paid | Tax Assessment Tax Assessment Total Assessment is a certain percentage of the fair market value that is determined by local assessors to be the total taxable value of land and additions on the property. | Land | Improvement |
|---|---|---|---|---|
| 2024 | $4,986 | $97,385 | $17,717 | $79,668 |
| 2023 | $4,736 | $88,880 | $16,170 | $72,710 |
| 2022 | $4,383 | $78,720 | $14,320 | $64,400 |
| 2021 | $4,527 | $75,740 | $13,780 | $61,960 |
| 2020 | $4,427 | $74,380 | $13,530 | $60,850 |
| 2019 | $4,289 | $71,160 | $12,940 | $58,220 |
| 2018 | $3,943 | $65,890 | $11,980 | $53,910 |
| 2017 | $3,857 | $63,670 | $11,580 | $52,090 |
| 2016 | $3,771 | $61,370 | $11,160 | $50,210 |
| 2015 | $3,733 | $57,790 | $10,510 | $47,280 |
| 2014 | $3,700 | $55,710 | $10,130 | $45,580 |
| 2013 | $3,645 | $55,840 | $10,150 | $45,690 |
Source: Public Records
Map
Nearby Homes
- 1751 S Washington St Unit 1
- 138 E Bailey Rd Unit M
- 128 E Bailey Rd Unit G
- 158 E Bailey Rd Unit F
- 621 Bourbon Ct
- 517 Sheffield Rd
- 302 Carriage Hill Rd
- 1921 Wisteria Ct Unit 3
- 1408 Swallow St
- 1449 Whitespire Ct Unit 5104
- 213 Winding Creek Dr
- 336 Brooklea Ct
- 23 Glencoe Ct Unit 202B
- 47 Glencoe Ct Unit 102D
- 2132 Berkley Ct Unit 201A
- 8S452 Bell Dr
- 303 Cedarbrook Rd
- 1443 Meander Dr
- 221 Hampshire Ct Unit 201D
- 2279 Kaskaskia Ct
- 1674 Cove Ct Unit 3
- 1670 Cove Ct Unit 1
- 1676 Cove Ct Unit 4
- 1668 Cove Ct Unit 5
- 1678 Cove Ct Unit 5
- 1666 Cove Ct
- 1680 Cove Ct Unit 6
- 1664 Cove Ct Unit 3
- 1673 Cove Ct
- 1675 Cove Ct Unit 2
- 1671 Cove Ct Unit 4
- 1662 Cove Ct Unit 2
- 1660 Cove Ct Unit 1
- 1657 Cove Ct Unit 1
- 1655 Cove Ct Unit 2
- 1653 Cove Ct Unit 3
- 1734 S Washington St Unit 1734
- 1732 S Washington St Unit 1732
- 1735 S Washington St Unit 1735
- 1641 Cove Ct Unit 4