Estimated Value: $241,000 - $251,526
2
Beds
2
Baths
1,283
Sq Ft
$192/Sq Ft
Est. Value
About This Home
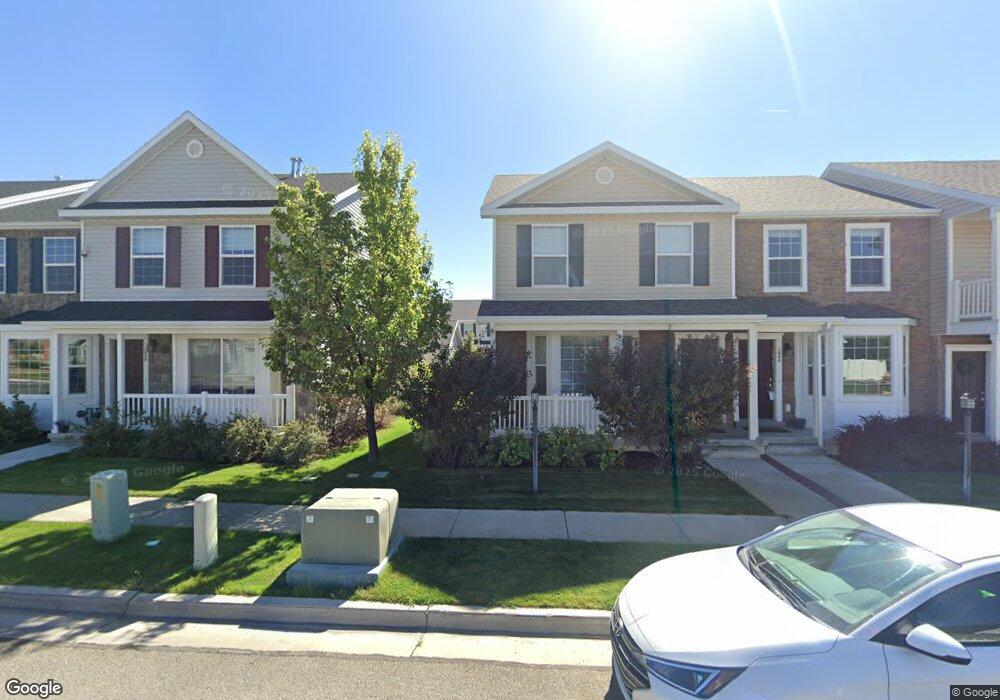
This home is located at 1672 E 450 N, Price, UT 84501 and is currently estimated at $246,382, approximately $192 per square foot. 1672 E 450 N is a home located in Carbon County with nearby schools including Castle Heights School, Mont Harmon Junior High School, and Carbon High School.
Ownership History
Date
Name
Owned For
Owner Type
Purchase Details
Closed on
Nov 22, 2019
Sold by
Auberger Tammy L and Auberger Charley N
Bought by
Smith Paul K and Smith Amber Yvette
Current Estimated Value
Home Financials for this Owner
Home Financials are based on the most recent Mortgage that was taken out on this home.
Original Mortgage
$86,500
Outstanding Balance
$76,161
Interest Rate
3.75%
Mortgage Type
New Conventional
Estimated Equity
$170,221
Purchase Details
Closed on
Oct 24, 2017
Sold by
Blocker Matthew J
Bought by
Auberger Tammy L and Auberger Charley N
Home Financials for this Owner
Home Financials are based on the most recent Mortgage that was taken out on this home.
Original Mortgage
$122,735
Interest Rate
4.25%
Mortgage Type
FHA
Purchase Details
Closed on
Jun 12, 2012
Sold by
Georgetown Development Inc
Bought by
Blocker Matthew J
Home Financials for this Owner
Home Financials are based on the most recent Mortgage that was taken out on this home.
Original Mortgage
$122,346
Interest Rate
3.74%
Mortgage Type
New Conventional
Create a Home Valuation Report for This Property
The Home Valuation Report is an in-depth analysis detailing your home's value as well as a comparison with similar homes in the area
Purchase History
| Date | Buyer | Sale Price | Title Company |
|---|---|---|---|
| Smith Paul K | -- | South Eastern Utah Title Co | |
| Auberger Tammy L | -- | South Eastern Utah Title Co | |
| Blocker Matthew J | -- | South Eastern Utah Title Com |
Source: Public Records
Mortgage History
| Date | Status | Borrower | Loan Amount |
|---|---|---|---|
| Open | Smith Paul K | $86,500 | |
| Previous Owner | Auberger Tammy L | $122,735 | |
| Previous Owner | Blocker Matthew J | $122,346 |
Source: Public Records
Tax History
| Year | Tax Paid | Tax Assessment Tax Assessment Total Assessment is a certain percentage of the fair market value that is determined by local assessors to be the total taxable value of land and additions on the property. | Land | Improvement |
|---|---|---|---|---|
| 2025 | $1,390 | $114,407 | $6,820 | $107,587 |
| 2024 | $1,494 | $124,350 | $49,500 | $74,850 |
| 2023 | $1,421 | $126,166 | $21,077 | $105,089 |
| 2022 | $1,470 | $117,130 | $17,524 | $99,606 |
| 2021 | $1,278 | $158,008 | $26,775 | $131,233 |
| 2020 | $1,258 | $78,080 | $0 | $0 |
| 2019 | $1,127 | $73,315 | $0 | $0 |
| 2018 | $1,062 | $70,479 | $0 | $0 |
| 2017 | $1,049 | $70,479 | $0 | $0 |
| 2016 | $946 | $70,479 | $0 | $0 |
| 2015 | $946 | $70,479 | $0 | $0 |
| 2014 | $940 | $70,479 | $0 | $0 |
| 2013 | $1,079 | $80,126 | $0 | $0 |
Source: Public Records
Map
Nearby Homes
- 546 Windsor Rd
- 1535 Sagewood Rd
- 1348 Sagewood Rd
- 688 Birch Cir
- 835 Essex Cir
- 330 N Pinewood Cir
- 1841 E 8th N Unit 78
- 831 N 1820 E Unit 66
- 1855 E 8th N Unit 77
- 1830 E 840 N Unit 80
- 1840 E 840 N Unit 81
- 1858 E 840 N Unit 82
- 1829 E 840 N Unit 87
- 349 Crestview Dr
- 1843 E 840 N Unit 86
- 380 N 700 E
- 1857 E 840 N Unit 85
- 1871 E 840 N Unit 84
- 838 N 1880 E Unit 73
- 854 N 1880 E Unit 72
- 1672 E 450 N
- 1672 E 450 N Unit 13
- 1678 E 450 N
- 1670 E 450 N
- 1670 E 450 N Unit 14
- 1662 E 450 N
- 1658 E 450 N
- 1654 E 450 N
- 1652 E 450 N
- 1674 Eastridge Rd
- 1684 Eastridge Rd
- 1660 Eastridge Rd
- 1676 Eastridge Rd
- 1680 Eastridge Rd Unit 2
- 1680 Eastridge Rd
- 1668 E Eastridge Rd N
- 1664 E 475 N
- 1660 E 475 N
- 1660 E 475 N Unit 7
- 1668 E 475 N
Your Personal Tour Guide
Ask me questions while you tour the home.