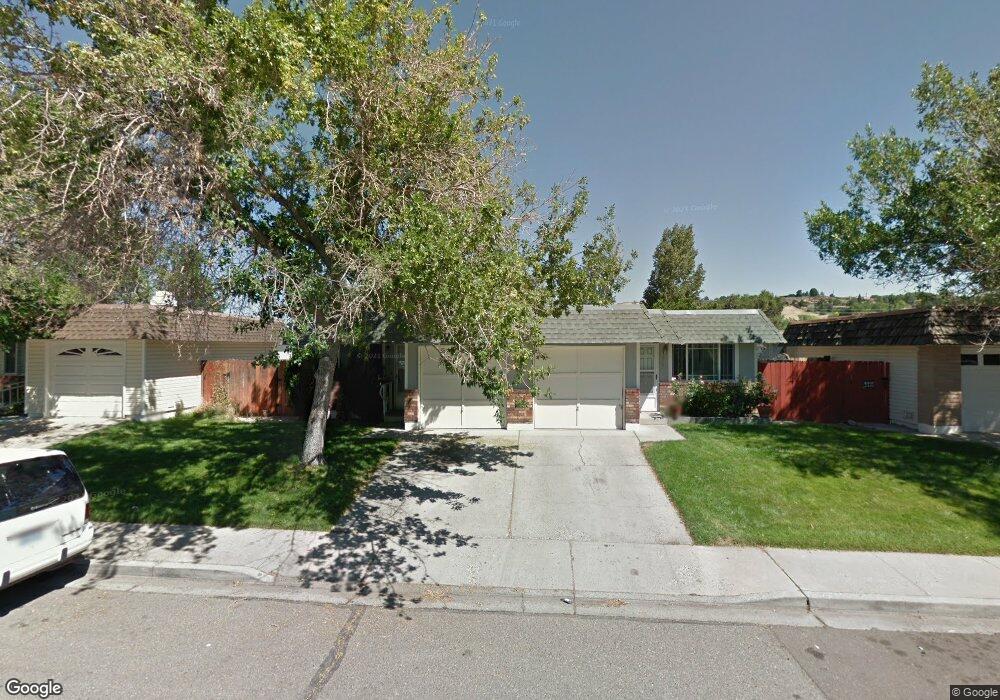
1672 Gault Way Unit D Sparks, NV 89431
North Rock NeighborhoodEstimated Value: $266,000 - $302,000
3
Beds
2
Baths
1,048
Sq Ft
$279/Sq Ft
Est. Value
About This Home
This home is located at 1672 Gault Way Unit D, Sparks, NV 89431 and is currently estimated at $292,117, approximately $278 per square foot. 1672 Gault Way Unit D is a home located in Washoe County with nearby schools including Alice Maxwell Elementary School, Sparks Middle School, and Sparks High School.
Ownership History
Date
Name
Owned For
Owner Type
Purchase Details
Closed on
Mar 18, 2021
Sold by
Magee Millicent Carlene
Bought by
William E And Millicent C Magee Family L and Magee
Current Estimated Value
Purchase Details
Closed on
Mar 2, 2021
Sold by
Odea Kelly A and Magee Michael D
Bought by
Odea Kelly A and Magee Michael D
Purchase Details
Closed on
Mar 19, 2018
Sold by
Magee William E
Bought by
Magee William E and Magee Millicent C
Purchase Details
Closed on
Dec 30, 2009
Sold by
Keever David
Bought by
Magee William E
Purchase Details
Closed on
Dec 22, 2009
Sold by
Magee Millicent C
Bought by
Magee William E
Purchase Details
Closed on
Oct 20, 2009
Sold by
Pirtle Joseph
Bought by
Keever David
Purchase Details
Closed on
Jun 7, 2004
Sold by
Pirtle Patricia J
Bought by
Pirtle Patricia J and Patricia J Pirtle Revocable Living Trust
Create a Home Valuation Report for This Property
The Home Valuation Report is an in-depth analysis detailing your home's value as well as a comparison with similar homes in the area
Home Values in the Area
Average Home Value in this Area
Purchase History
| Date | Buyer | Sale Price | Title Company |
|---|---|---|---|
| William E And Millicent C Magee Family L | -- | -- | |
| Odea Kelly A | -- | None Available | |
| Magee William E | -- | None Available | |
| Magee William E | $77,500 | Western Title Inc Ridge | |
| Magee William E | -- | Western Title Inc Ridge | |
| Keever David | $45,000 | Western Title Inc Ridge | |
| Pirtle Patricia J | -- | -- |
Source: Public Records
Tax History Compared to Growth
Tax History
| Year | Tax Paid | Tax Assessment Tax Assessment Total Assessment is a certain percentage of the fair market value that is determined by local assessors to be the total taxable value of land and additions on the property. | Land | Improvement |
|---|---|---|---|---|
| 2025 | $626 | $37,474 | $24,633 | $12,841 |
| 2024 | $626 | $36,189 | $23,247 | $12,942 |
| 2023 | $580 | $31,536 | $20,381 | $11,156 |
| 2022 | $533 | $26,078 | $16,632 | $9,446 |
| 2021 | $523 | $19,910 | $10,647 | $9,263 |
| 2020 | $506 | $20,324 | $10,647 | $9,677 |
| 2019 | $491 | $20,566 | $10,836 | $9,730 |
| 2018 | $477 | $16,435 | $6,615 | $9,820 |
| 2017 | $463 | $16,308 | $6,384 | $9,924 |
| 2016 | $452 | $15,583 | $5,220 | $10,363 |
| 2015 | $451 | $15,076 | $4,223 | $10,853 |
| 2014 | $437 | $13,513 | $2,893 | $10,620 |
| 2013 | -- | $13,068 | $2,294 | $10,774 |
Source: Public Records
Map
Nearby Homes
- 1731 Gault Way Unit D
- 1620 Gault Way
- 0 N Mccarran Blvd Unit 250052909
- 1595 York Way
- 1345 Plymouth Way
- 2154 Oppio St
- 1125 Dodson Way
- 1160 York Way
- 1799 Vance Way
- 3269 Valley Forge Way
- 1655 Byrd Dr
- 1110 Xman Way
- 3492 Mashie Dr
- 3252 Holman Way
- 3516 Brassie Dr
- 5530 High Rock Way
- 3116 Sterling Ridge Cir
- 3230 Creekside Ln Unit 1
- 1124 Sbragia Way
- 1780 Greenbrae Dr
- 1670 Gault Way Unit C
- 1680 Gault Way Unit A
- 1692 Gault Way
- 1662 Gault Way
- 1662 Gault Way Unit B
- 1682 Gault Way
- 1660 Gault Way Unit A
- 1690 Gault Way Unit C
- 1652 Gault Way Unit B
- 1669 Gault Way Unit E
- 1681 Gault Way Unit F
- 1650 Gault Way Unit A
- 1667 Gault Way
- 1683 Gault Way Unit E
- 1700 Gault Way
- 1702 Gault Way Unit D
- 1653 Gault Way Unit E
- 1642 Gault Way
- 1663 Gault Way
- 1687 Gault Way