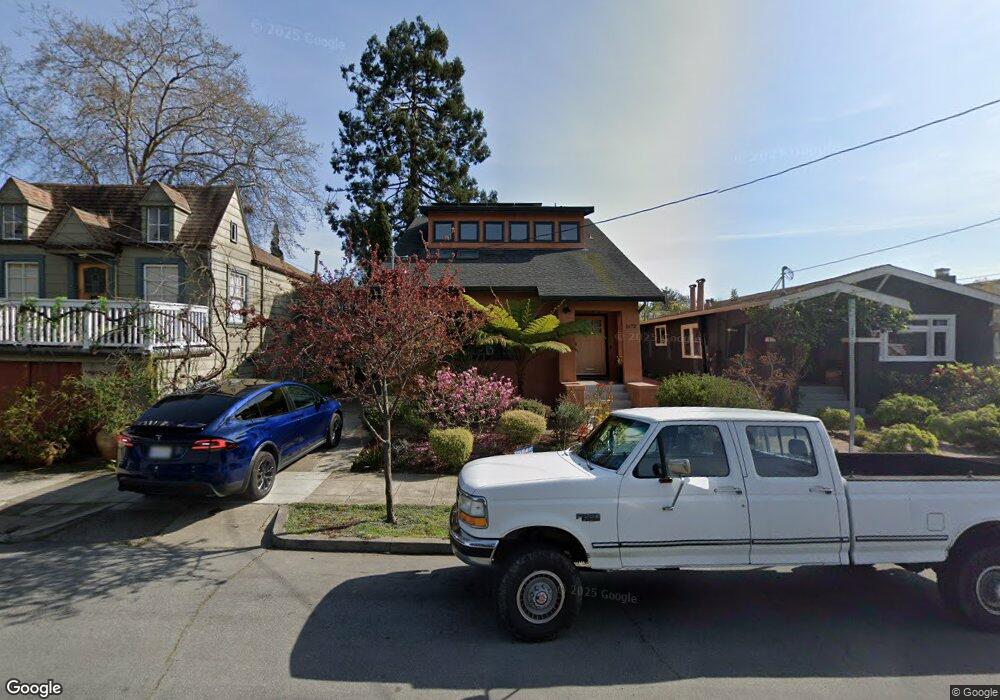
1672 Lincoln St Berkeley, CA 94703
North Berkeley NeighborhoodEstimated Value: $2,342,000 - $2,987,556
4
Beds
3
Baths
2,150
Sq Ft
$1,228/Sq Ft
Est. Value
About This Home
This home is located at 1672 Lincoln St, Berkeley, CA 94703 and is currently estimated at $2,640,889, approximately $1,228 per square foot. 1672 Lincoln St is a home located in Alameda County with nearby schools including Berkeley Arts Magnet at Whittier School, Ruth Acty Elementary, and Thousand Oaks Elementary School.
Ownership History
Date
Name
Owned For
Owner Type
Purchase Details
Closed on
Jun 11, 2021
Sold by
Seefeld Bernhard
Bought by
Seefeld Bernhard and Bernhard Seefeld Family Trust
Current Estimated Value
Purchase Details
Closed on
Mar 21, 2019
Sold by
Hollander Matthew Adam and Hollander Jui Ting Anna
Bought by
Seefeld Bernhard
Purchase Details
Closed on
Sep 11, 2012
Sold by
Mun Mun Yookie Yookie and Mun Po Word
Bought by
Hollander Matthew Adam and Hollander Jui Ting Anna
Home Financials for this Owner
Home Financials are based on the most recent Mortgage that was taken out on this home.
Original Mortgage
$540,000
Interest Rate
3.5%
Mortgage Type
New Conventional
Purchase Details
Closed on
Jun 30, 2009
Sold by
Mun Yookie and The Po Word Mun & Yip Fong Chu
Bought by
Mun Yookie and The Po Word Mun & Yip Fong Chu
Purchase Details
Closed on
Dec 18, 1993
Sold by
Mun Po Word and Mun Yip Fong Chun
Bought by
Mun Po Word and Mun Yip Fong Chun
Create a Home Valuation Report for This Property
The Home Valuation Report is an in-depth analysis detailing your home's value as well as a comparison with similar homes in the area
Home Values in the Area
Average Home Value in this Area
Purchase History
| Date | Buyer | Sale Price | Title Company |
|---|---|---|---|
| Seefeld Bernhard | -- | None Available | |
| Seefeld Bernhard | $2,800,000 | Chicago Title Company | |
| Hollander Matthew Adam | $675,000 | Chicago Title Company | |
| Mun Yookie | -- | None Available | |
| Mun Po Word | -- | -- |
Source: Public Records
Mortgage History
| Date | Status | Borrower | Loan Amount |
|---|---|---|---|
| Previous Owner | Hollander Matthew Adam | $540,000 |
Source: Public Records
Tax History
| Year | Tax Paid | Tax Assessment Tax Assessment Total Assessment is a certain percentage of the fair market value that is determined by local assessors to be the total taxable value of land and additions on the property. | Land | Improvement |
|---|---|---|---|---|
| 2025 | $41,758 | $3,116,400 | $937,020 | $2,186,380 |
| 2024 | $41,758 | $3,055,163 | $918,649 | $2,143,514 |
| 2023 | $40,905 | $3,002,131 | $900,639 | $2,101,492 |
| 2022 | $40,270 | $2,936,275 | $882,982 | $2,060,293 |
| 2021 | $40,476 | $2,878,567 | $865,670 | $2,019,897 |
| 2020 | $38,700 | $2,856,000 | $856,800 | $1,999,200 |
| 2019 | $14,522 | $904,465 | $223,537 | $680,928 |
| 2018 | $14,245 | $886,735 | $219,155 | $667,580 |
| 2017 | $13,935 | $869,349 | $214,858 | $654,491 |
| 2016 | $13,037 | $852,306 | $210,646 | $641,660 |
| 2015 | $12,852 | $839,508 | $207,483 | $632,025 |
| 2014 | $12,265 | $750,064 | $203,419 | $546,645 |
Source: Public Records
Map
Nearby Homes
- 1808 Cedar St
- 1564 Sacramento St
- 1625 Martin Luther King jr Way
- 1813 Sacramento St
- 1609 Bonita Ave Unit 5
- 1610 Milvia St
- 1368 Rose St
- 1411 Hearst Ave Unit 2
- 1425 Martin Luther King jr Way
- 1626 Hopkins St
- 2112 Mckinley Ave Unit D
- 2118 California St
- 1322 Virginia St
- 2218 -2222 Grant St
- 1408 Henry St
- 1631 Belvedere Ave
- 1578 Allston Way
- 1261 Hearst Ave
- 1682 Oxford St
- 1444 Walnut St
- 1676 Lincoln St
- 1668 Lincoln St
- 1660 Lincoln St
- 1636 McGee Ave
- 1634 McGee Ave
- 1632 McGee Ave
- 1630 McGee Ave
- 1654 Lincoln St
- 1641 Virginia St
- 1643 Virginia St
- 1639 Virginia St
- 1645 Virginia St
- 1635 Virginia St
- 1644 Lincoln St
- 1647 Virginia St
- 1639 Lincoln St
- 1625 Virginia St
- 1635 Lincoln St
- 1631 Lincoln St
- 1629 Lincoln St
Your Personal Tour Guide
Ask me questions while you tour the home.