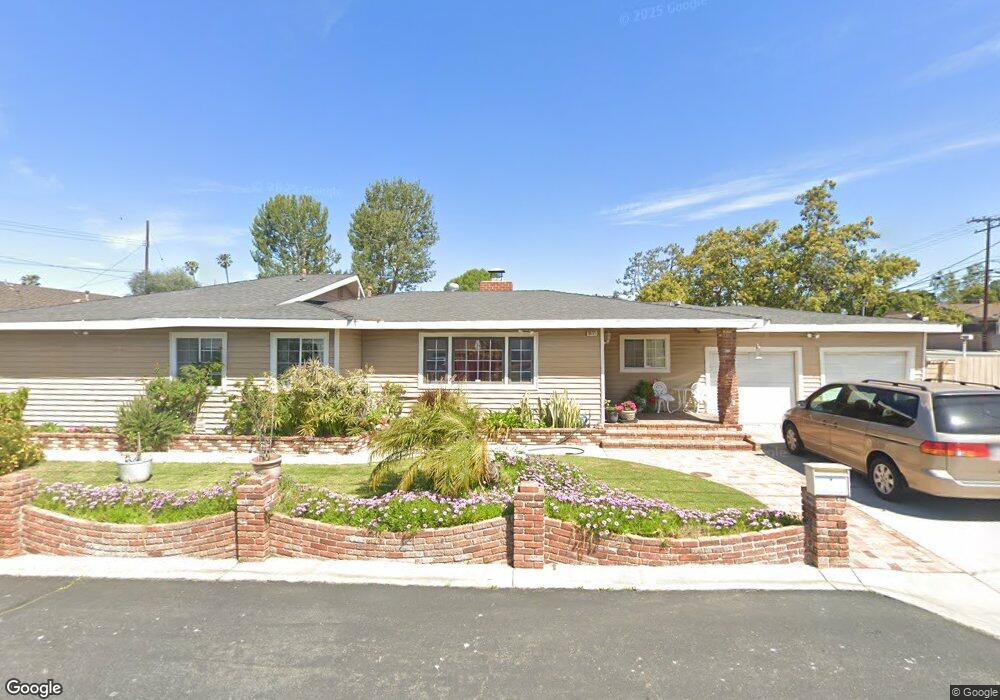
16721 Camille Place Yorba Linda, CA 92886
Estimated Value: $1,006,000 - $1,198,000
4
Beds
2
Baths
1,785
Sq Ft
$617/Sq Ft
Est. Value
About This Home
This home is located at 16721 Camille Place, Yorba Linda, CA 92886 and is currently estimated at $1,101,031, approximately $616 per square foot. 16721 Camille Place is a home located in Orange County with nearby schools including Rose Drive Elementary, Yorba Linda Middle School, and El Dorado High School.
Ownership History
Date
Name
Owned For
Owner Type
Purchase Details
Closed on
May 18, 2010
Sold by
B & K Homes Limited Llc
Bought by
Ellison Timothy S and Ellison Barbara N
Current Estimated Value
Home Financials for this Owner
Home Financials are based on the most recent Mortgage that was taken out on this home.
Original Mortgage
$378,250
Outstanding Balance
$255,505
Interest Rate
5.21%
Mortgage Type
New Conventional
Estimated Equity
$845,527
Purchase Details
Closed on
Sep 30, 2009
Sold by
Olvera Mario
Bought by
B & K Homes Limited Llc
Purchase Details
Closed on
Mar 18, 2005
Sold by
Rough David Scott and Rough Kathleen
Bought by
Olvera Mario
Home Financials for this Owner
Home Financials are based on the most recent Mortgage that was taken out on this home.
Original Mortgage
$484,000
Interest Rate
1%
Mortgage Type
FHA
Create a Home Valuation Report for This Property
The Home Valuation Report is an in-depth analysis detailing your home's value as well as a comparison with similar homes in the area
Home Values in the Area
Average Home Value in this Area
Purchase History
| Date | Buyer | Sale Price | Title Company |
|---|---|---|---|
| Ellison Timothy S | $445,000 | First American Title Company | |
| B & K Homes Limited Llc | $380,000 | None Available | |
| Olvera Mario | $605,000 | Southland Title Corporation |
Source: Public Records
Mortgage History
| Date | Status | Borrower | Loan Amount |
|---|---|---|---|
| Open | Ellison Timothy S | $378,250 | |
| Previous Owner | Olvera Mario | $484,000 | |
| Closed | Olvera Mario | $60,500 |
Source: Public Records
Tax History Compared to Growth
Tax History
| Year | Tax Paid | Tax Assessment Tax Assessment Total Assessment is a certain percentage of the fair market value that is determined by local assessors to be the total taxable value of land and additions on the property. | Land | Improvement |
|---|---|---|---|---|
| 2025 | $6,133 | $574,409 | $482,412 | $91,997 |
| 2024 | $6,133 | $563,147 | $472,953 | $90,194 |
| 2023 | $6,026 | $552,105 | $463,679 | $88,426 |
| 2022 | $5,972 | $541,280 | $454,587 | $86,693 |
| 2021 | $5,861 | $530,667 | $445,673 | $84,994 |
| 2020 | $5,766 | $525,226 | $441,103 | $84,123 |
| 2019 | $5,551 | $514,928 | $432,454 | $82,474 |
| 2018 | $5,481 | $504,832 | $423,975 | $80,857 |
| 2017 | $5,390 | $494,934 | $415,662 | $79,272 |
| 2016 | $5,278 | $485,230 | $407,512 | $77,718 |
| 2015 | $5,215 | $477,942 | $401,391 | $76,551 |
| 2014 | $5,056 | $468,580 | $393,528 | $75,052 |
Source: Public Records
Map
Nearby Homes
- 4942 Gem Ln
- 1429 Prospect Ave Unit B
- 4802 Brookway Ave
- 16692 Meadowview Dr
- 4781 Kona Kove Way
- 4882 Kermath St
- 17001 La Kenice Way
- 1261 Desoto St
- 11715 Rose Dr
- 943 Berkenstock Ln
- 1701 Shaw Cir
- 1000 Henrietta Cir
- 619 E Yorba Linda Blvd
- 5130 Webb Place
- 719 Cobb Ave
- 727 Olivier Dr
- 732 Olivier Dr
- 726 Olivier Dr
- 17225 Orange Blossom Ln
- 718 Olivier Dr