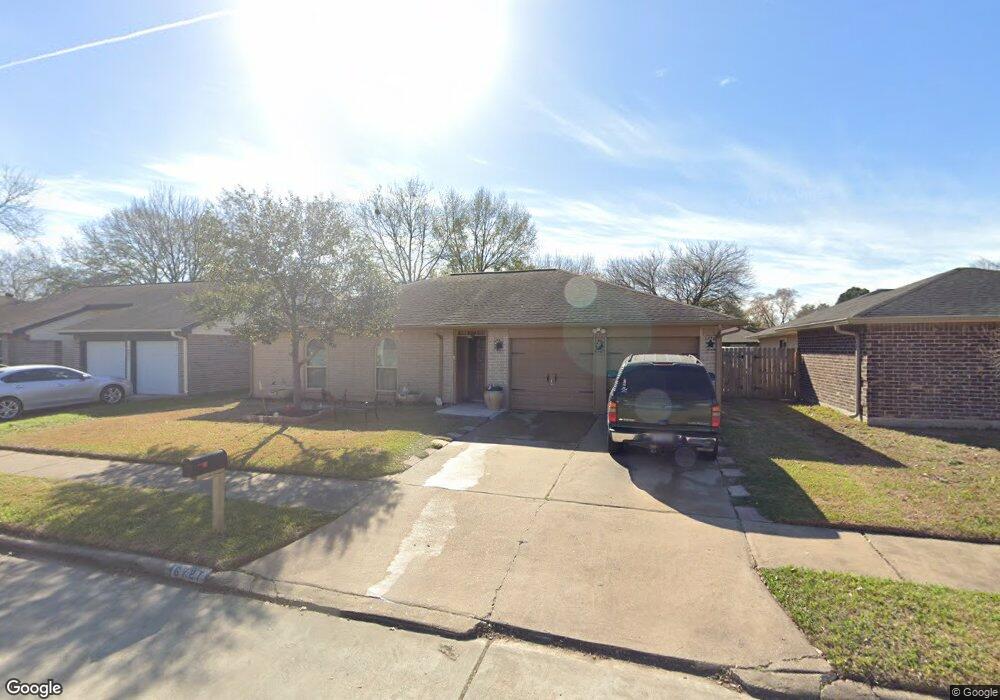
16727 Summer Dew Ln Houston, TX 77095
Copperfield NeighborhoodEstimated Value: $216,000 - $235,000
3
Beds
2
Baths
1,237
Sq Ft
$182/Sq Ft
Est. Value
About This Home
This home is located at 16727 Summer Dew Ln, Houston, TX 77095 and is currently estimated at $224,800, approximately $181 per square foot. 16727 Summer Dew Ln is a home located in Harris County with nearby schools including Holmsley Elementary School, Aragon Middle School, and Langham Creek High School.
Ownership History
Date
Name
Owned For
Owner Type
Purchase Details
Closed on
May 13, 2015
Sold by
Clayton Sue E and Clayton Richard D
Bought by
Colemenro Fernando Barrientos and Guerrero Angelica M
Current Estimated Value
Home Financials for this Owner
Home Financials are based on the most recent Mortgage that was taken out on this home.
Original Mortgage
$77,000
Interest Rate
3.62%
Mortgage Type
Adjustable Rate Mortgage/ARM
Purchase Details
Closed on
Dec 31, 2014
Sold by
Clayton Lula May
Bought by
Clayton Sue E and Clayton Richard D
Purchase Details
Closed on
Sep 7, 2009
Sold by
Clayton Sue and Clayton Lula Mae
Bought by
Clayton Lula Mae
Purchase Details
Closed on
Nov 3, 2008
Sold by
Polomskey Delores
Bought by
Clayton Sue
Purchase Details
Closed on
Feb 6, 1998
Sold by
Chen Allen H and Chan Janet
Bought by
Polomskey Delores J
Create a Home Valuation Report for This Property
The Home Valuation Report is an in-depth analysis detailing your home's value as well as a comparison with similar homes in the area
Home Values in the Area
Average Home Value in this Area
Purchase History
| Date | Buyer | Sale Price | Title Company |
|---|---|---|---|
| Colemenro Fernando Barrientos | -- | None Available | |
| Clayton Sue E | -- | None Available | |
| Clayton Lula Mae | -- | None Available | |
| Clayton Sue | -- | None Available | |
| Polomskey Delores J | -- | Commonwealth Land Title Co |
Source: Public Records
Mortgage History
| Date | Status | Borrower | Loan Amount |
|---|---|---|---|
| Previous Owner | Colemenro Fernando Barrientos | $77,000 |
Source: Public Records
Tax History Compared to Growth
Tax History
| Year | Tax Paid | Tax Assessment Tax Assessment Total Assessment is a certain percentage of the fair market value that is determined by local assessors to be the total taxable value of land and additions on the property. | Land | Improvement |
|---|---|---|---|---|
| 2025 | $5,240 | $211,294 | $49,988 | $161,306 |
| 2024 | $5,240 | $211,294 | $49,988 | $161,306 |
| 2023 | $5,240 | $212,067 | $49,988 | $162,079 |
| 2022 | $4,807 | $192,799 | $41,603 | $151,196 |
| 2021 | $4,192 | $161,465 | $41,603 | $119,862 |
| 2020 | $3,774 | $139,546 | $31,928 | $107,618 |
| 2019 | $3,450 | $133,168 | $23,865 | $109,303 |
| 2018 | $1,771 | $122,974 | $23,865 | $99,109 |
| 2017 | $3,145 | $120,905 | $23,865 | $97,040 |
| 2016 | $3,005 | $115,525 | $23,865 | $91,660 |
| 2015 | $610 | $104,393 | $15,803 | $88,590 |
| 2014 | $610 | $89,764 | $15,803 | $73,961 |
Source: Public Records
Map
Nearby Homes
- 7254 Sonnet Glen Ln
- 7307 Sunlight Ln
- 7215 Daylight Ln
- 16734 Pebbleglen Dr
- 17015 Sky Blue Place
- 16714 Rockbend
- 7311 Barton Oaks Dr
- 16606 Cliff Vale Ct
- 7306 Bubbling Brooks Ln
- 16706 Blairstone
- 16331 Dew Drop Ln
- 16614 Live Oak Canyon Dr
- 6831 Beck Canyon Dr
- 6839 Catarina Cir
- 16715 Britford
- 7519 Sunlight Ln
- 7607 Plumtree Forest Cir
- 16346 Pebbleglen Dr
- 7311 Postwick Ct
- 6711 Knoll Spring Way
- 16731 Summer Dew Ln
- 16723 Summer Dew Ln
- 16726 Summer Dawn Ln
- 16722 Summer Dawn Ln
- 16735 Summer Dew Ln
- 16719 Summer Dew Ln
- 16730 Summer Dawn Ln
- 16718 Summer Dawn Ln
- 16726 Summer Dew Ln
- 16722 Summer Dew Ln
- 16730 Summer Dew Ln
- 16739 Summer Dew Ln
- 16715 Summer Dew Ln
- 16734 Summer Dawn Ln
- 16718 Summer Dew Ln
- 16714 Summer Dawn Ln
- 16734 Summer Dew Ln
- 16714 Summer Dew Ln
- 16711 Summer Dew Ln
- 16738 Summer Dawn Ln