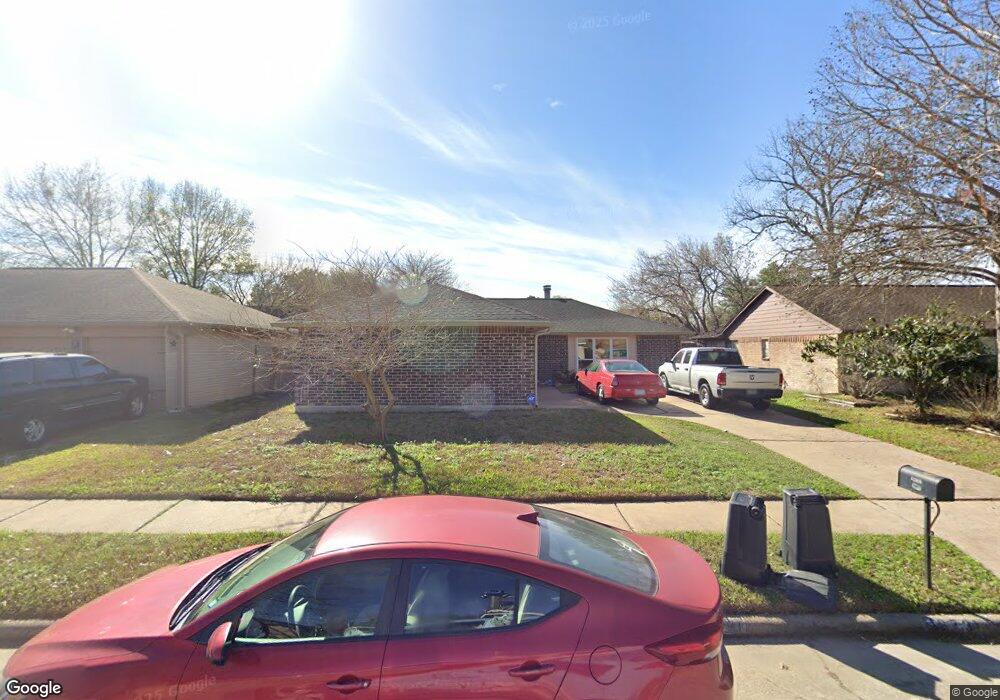
16731 Summer Dew Ln Houston, TX 77095
Copperfield NeighborhoodEstimated Value: $206,000 - $248,000
4
Beds
2
Baths
1,402
Sq Ft
$164/Sq Ft
Est. Value
About This Home
This home is located at 16731 Summer Dew Ln, Houston, TX 77095 and is currently estimated at $229,419, approximately $163 per square foot. 16731 Summer Dew Ln is a home located in Harris County with nearby schools including Holmsley Elementary School, Aragon Middle School, and Langham Creek High School.
Ownership History
Date
Name
Owned For
Owner Type
Purchase Details
Closed on
Apr 14, 2016
Sold by
Hyder Syed and Hyder Muneer
Bought by
Garza Jose
Current Estimated Value
Home Financials for this Owner
Home Financials are based on the most recent Mortgage that was taken out on this home.
Original Mortgage
$125,190
Outstanding Balance
$99,684
Interest Rate
3.75%
Mortgage Type
FHA
Estimated Equity
$129,735
Purchase Details
Closed on
May 10, 2010
Sold by
The Bank Of New York Mellon
Bought by
Hyder Syed
Purchase Details
Closed on
Feb 2, 2010
Sold by
Carreon Tomas
Bought by
The Bank Of New York Mellon
Purchase Details
Closed on
Oct 21, 2005
Sold by
Carter William M and Carter Jo Ann
Bought by
Carreon Tomas
Home Financials for this Owner
Home Financials are based on the most recent Mortgage that was taken out on this home.
Original Mortgage
$18,200
Interest Rate
5.75%
Mortgage Type
Stand Alone Second
Create a Home Valuation Report for This Property
The Home Valuation Report is an in-depth analysis detailing your home's value as well as a comparison with similar homes in the area
Home Values in the Area
Average Home Value in this Area
Purchase History
| Date | Buyer | Sale Price | Title Company |
|---|---|---|---|
| Garza Jose | -- | Old Republic Title Insurance | |
| Hyder Syed | -- | Lsi Title Agency Inc | |
| The Bank Of New York Mellon | $82,604 | None Available | |
| Carreon Tomas | -- | -- |
Source: Public Records
Mortgage History
| Date | Status | Borrower | Loan Amount |
|---|---|---|---|
| Open | Garza Jose | $125,190 | |
| Previous Owner | Carreon Tomas | $18,200 | |
| Previous Owner | Carreon Tomas | $72,800 |
Source: Public Records
Tax History Compared to Growth
Tax History
| Year | Tax Paid | Tax Assessment Tax Assessment Total Assessment is a certain percentage of the fair market value that is determined by local assessors to be the total taxable value of land and additions on the property. | Land | Improvement |
|---|---|---|---|---|
| 2025 | $1,002 | $215,460 | $49,988 | $165,472 |
| 2024 | $1,002 | $215,460 | $49,988 | $165,472 |
| 2023 | $1,002 | $216,270 | $49,988 | $166,282 |
| 2022 | $4,068 | $182,220 | $41,603 | $140,617 |
| 2021 | $3,851 | $164,801 | $41,603 | $123,198 |
| 2020 | $3,647 | $134,864 | $31,928 | $102,936 |
| 2019 | $3,446 | $136,061 | $23,865 | $112,196 |
| 2018 | $1,085 | $125,435 | $23,865 | $101,570 |
| 2017 | $3,207 | $123,283 | $23,865 | $99,418 |
| 2016 | $2,969 | $114,119 | $23,865 | $90,254 |
| 2015 | $1,686 | $102,976 | $15,803 | $87,173 |
| 2014 | $1,686 | $88,260 | $15,803 | $72,457 |
Source: Public Records
Map
Nearby Homes
- 7254 Sonnet Glen Ln
- 7307 Sunlight Ln
- 7215 Daylight Ln
- 16734 Pebbleglen Dr
- 17015 Sky Blue Place
- 16714 Rockbend
- 7311 Barton Oaks Dr
- 16606 Cliff Vale Ct
- 7306 Bubbling Brooks Ln
- 16706 Blairstone
- 16331 Dew Drop Ln
- 16614 Live Oak Canyon Dr
- 6831 Beck Canyon Dr
- 6839 Catarina Cir
- 16715 Britford
- 7519 Sunlight Ln
- 7607 Plumtree Forest Cir
- 16346 Pebbleglen Dr
- 7311 Postwick Ct
- 6711 Knoll Spring Way
- 16727 Summer Dew Ln
- 16735 Summer Dew Ln
- 16730 Summer Dawn Ln
- 16726 Summer Dawn Ln
- 16739 Summer Dew Ln
- 16723 Summer Dew Ln
- 16734 Summer Dawn Ln
- 16722 Summer Dawn Ln
- 16730 Summer Dew Ln
- 16726 Summer Dew Ln
- 16734 Summer Dew Ln
- 16719 Summer Dew Ln
- 16743 Summer Dew Ln
- 16738 Summer Dawn Ln
- 16718 Summer Dawn Ln
- 16722 Summer Dew Ln
- 16738 Summer Dew Ln
- 16718 Summer Dew Ln
- 16715 Summer Dew Ln
- 16742 Summer Dawn Ln