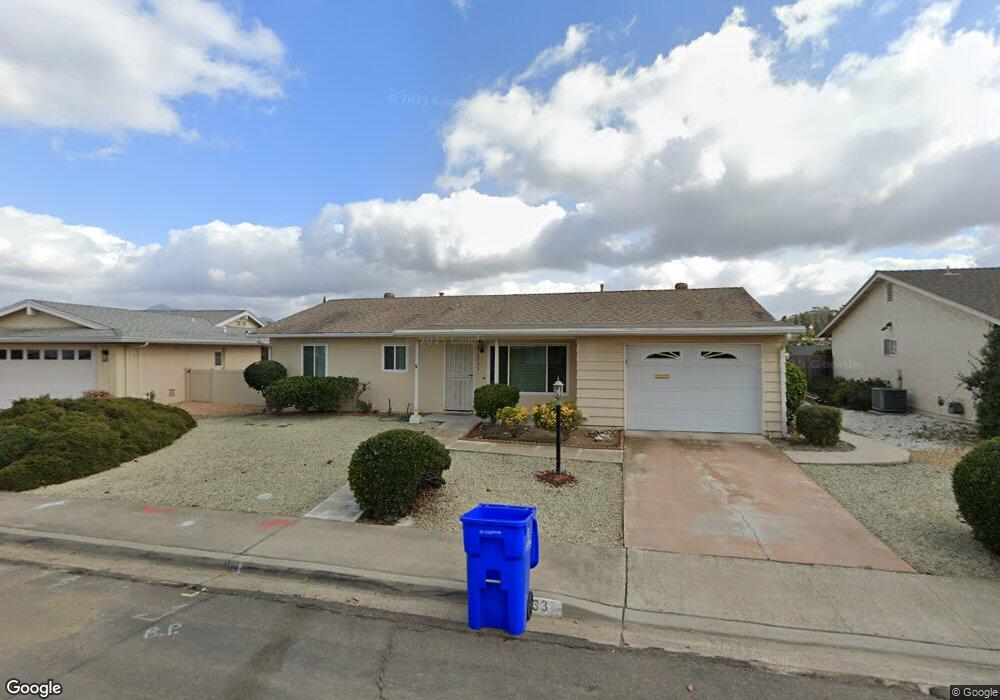
16733 Obispo Ln Unit 4 San Diego, CA 92128
Rancho Bernardo NeighborhoodEstimated Value: $707,714 - $878,000
2
Beds
1
Bath
1,000
Sq Ft
$787/Sq Ft
Est. Value
About This Home
This home is located at 16733 Obispo Ln Unit 4, San Diego, CA 92128 and is currently estimated at $787,179, approximately $787 per square foot. 16733 Obispo Ln Unit 4 is a home located in San Diego County with nearby schools including Highland Ranch Elementary School, Bernardo Heights Middle, and Rancho Bernardo High.
Ownership History
Date
Name
Owned For
Owner Type
Purchase Details
Closed on
May 10, 2021
Sold by
Lampe Ramona Elaine
Bought by
Lampe Ramona Elaine and Revocable Trust Agmt Of Ramona
Current Estimated Value
Purchase Details
Closed on
Sep 9, 2020
Sold by
Lampe Ramona Elaine and Complete Restatement Of Lampe
Bought by
Lampe Ramons Elaine
Purchase Details
Closed on
Dec 18, 2001
Sold by
Lampe Karlheinz P and Lampe Bertha K
Bought by
Lampe Karlheinz Paul and Lampe Bertha Klara
Home Financials for this Owner
Home Financials are based on the most recent Mortgage that was taken out on this home.
Original Mortgage
$144,000
Interest Rate
6.04%
Purchase Details
Closed on
Nov 5, 2001
Sold by
Moreau Barbara J and Johnson Thomas J
Bought by
Lampe Karlheinz and Lampe Bertha K
Home Financials for this Owner
Home Financials are based on the most recent Mortgage that was taken out on this home.
Original Mortgage
$144,000
Interest Rate
6.04%
Create a Home Valuation Report for This Property
The Home Valuation Report is an in-depth analysis detailing your home's value as well as a comparison with similar homes in the area
Home Values in the Area
Average Home Value in this Area
Purchase History
| Date | Buyer | Sale Price | Title Company |
|---|---|---|---|
| Lampe Ramona Elaine | -- | None Available | |
| Lampe Ramons Elaine | -- | None Available | |
| Lampe Karlheinz Paul | -- | -- | |
| Lampe Karlheinz | $216,000 | California Title Company |
Source: Public Records
Mortgage History
| Date | Status | Borrower | Loan Amount |
|---|---|---|---|
| Closed | Lampe Karlheinz | $144,000 |
Source: Public Records
Tax History Compared to Growth
Tax History
| Year | Tax Paid | Tax Assessment Tax Assessment Total Assessment is a certain percentage of the fair market value that is determined by local assessors to be the total taxable value of land and additions on the property. | Land | Improvement |
|---|---|---|---|---|
| 2025 | $3,578 | $319,073 | $194,689 | $124,384 |
| 2024 | $3,578 | $312,818 | $190,872 | $121,946 |
| 2023 | $3,502 | $306,685 | $187,130 | $119,555 |
| 2022 | $3,444 | $300,672 | $183,461 | $117,211 |
| 2021 | $3,399 | $294,777 | $179,864 | $114,913 |
| 2020 | $3,354 | $291,755 | $178,020 | $113,735 |
| 2019 | $3,268 | $286,035 | $174,530 | $111,505 |
| 2018 | $3,099 | $280,427 | $171,108 | $109,319 |
| 2017 | $3,015 | $274,929 | $167,753 | $107,176 |
| 2016 | $2,951 | $269,539 | $164,464 | $105,075 |
| 2015 | $2,907 | $265,491 | $161,994 | $103,497 |
| 2014 | $2,838 | $260,291 | $158,821 | $101,470 |
Source: Public Records
Map
Nearby Homes
- 16710 Obispo Ln
- 12085 Calle de Maria
- 11941 Callado Rd
- 16846 Dominican Dr Unit 4
- 16799 Acena Dr
- 16731 Acena Dr
- 16866 Acebo Dr
- 12093 Callado Rd
- 16859 Acebo Dr
- 16924 Bellota Dr
- 16734 Bernardo Oaks Dr
- 12215 Santiago Rd W Unit Santiago
- 12195 San Tomas Place
- 12215 Rios Rd
- 12047 Avenida Consentido
- 16421 Ramada Dr
- 16430 Avenida Venusto Unit D
- 16464 Avenida Venusto Unit C
- 16660 Roca Dr
- 12424 Rios Rd
- 16725 Obispo Ln
- 16741 Obispo Ln
- 12068 Pastoral Rd
- 12060 Pastoral Rd
- 12074 Pastoral Rd
- 16717 Obispo Ln
- 16740 Obispo Ln
- 16749 Obispo Ln
- 12082 Pastoral Rd
- 12052 Pastoral Rd
- 16726 Obispo Ln
- 12041 Obispo Rd
- 12055 Obispo Rd
- 16709 Obispo Ln
- 12090 Pastoral Rd
- 12044 Pastoral Rd
- 12031 Obispo Rd
- 16701 Obispo Ln
- 12065 Obispo Rd
- 12065 Pastoral Rd