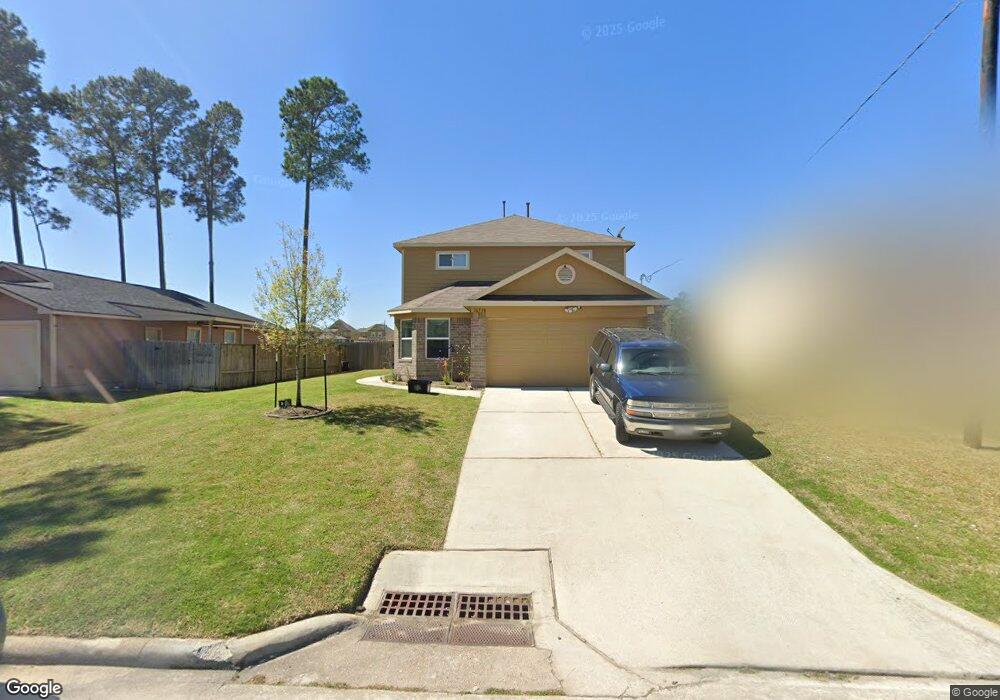
16738 Fallen Timbers Dr Conroe, TX 77385
Estimated Value: $253,845 - $300,000
--
Bed
--
Bath
2,261
Sq Ft
$121/Sq Ft
Est. Value
About This Home
This home is located at 16738 Fallen Timbers Dr, Conroe, TX 77385 and is currently estimated at $273,711, approximately $121 per square foot. 16738 Fallen Timbers Dr is a home with nearby schools including Oak Ridge Elementary School, Irons J High School, and Vogel Intermediate School.
Ownership History
Date
Name
Owned For
Owner Type
Purchase Details
Closed on
Jul 29, 2016
Sold by
Long Lake Ltd
Bought by
Garcia Leslie E Morales and Garcia Edgar G Morales
Current Estimated Value
Home Financials for this Owner
Home Financials are based on the most recent Mortgage that was taken out on this home.
Original Mortgage
$164,710
Outstanding Balance
$135,180
Interest Rate
4.4%
Mortgage Type
FHA
Estimated Equity
$138,531
Purchase Details
Closed on
Jul 19, 2016
Sold by
Woodmere Development Co Ltd
Bought by
Garcia Edgar G and Garcia Leslie E
Home Financials for this Owner
Home Financials are based on the most recent Mortgage that was taken out on this home.
Original Mortgage
$164,710
Outstanding Balance
$135,180
Interest Rate
4.4%
Mortgage Type
FHA
Estimated Equity
$138,531
Purchase Details
Closed on
Oct 17, 2011
Sold by
Long Lake Ltd
Bought by
Garcia Edgar G and Garcia Leslie E
Create a Home Valuation Report for This Property
The Home Valuation Report is an in-depth analysis detailing your home's value as well as a comparison with similar homes in the area
Home Values in the Area
Average Home Value in this Area
Purchase History
| Date | Buyer | Sale Price | Title Company |
|---|---|---|---|
| Garcia Leslie E Morales | -- | South Land Title Llc | |
| Garcia Edgar G | -- | -- | |
| Garcia Edgar G | -- | -- |
Source: Public Records
Mortgage History
| Date | Status | Borrower | Loan Amount |
|---|---|---|---|
| Open | Garcia Leslie E Morales | $164,710 |
Source: Public Records
Tax History Compared to Growth
Tax History
| Year | Tax Paid | Tax Assessment Tax Assessment Total Assessment is a certain percentage of the fair market value that is determined by local assessors to be the total taxable value of land and additions on the property. | Land | Improvement |
|---|---|---|---|---|
| 2025 | $6,183 | $300,461 | $17,325 | $283,136 |
| 2024 | $6,586 | $278,420 | $17,325 | $261,095 |
| 2023 | $6,586 | $296,380 | $17,330 | $279,050 |
| 2022 | $5,465 | $266,400 | $17,330 | $249,070 |
| 2021 | $5,187 | $198,820 | $17,330 | $181,490 |
| 2020 | $5,152 | $186,800 | $17,330 | $169,470 |
| 2019 | $5,320 | $184,440 | $12,520 | $171,920 |
| 2018 | $4,873 | $168,940 | $12,520 | $156,420 |
| 2017 | $4,965 | $168,940 | $12,520 | $156,420 |
| 2016 | $368 | $12,520 | $12,520 | $0 |
| 2015 | $404 | $12,520 | $12,520 | $0 |
| 2014 | $404 | $12,520 | $12,520 | $0 |
Source: Public Records
Map
Nearby Homes
- 16774 Fallen Timbers Dr
- 16751 N Rail Dr
- 16771 N Rail Dr
- 16778 N Gull Dr
- 10311 Woodhollow Dr
- 9877 Lace Flower Way
- 9921 Kingfisher Dr
- 10003 S Whimbrel Cir
- 3420 Chestnut Colony Ct
- 9838 Bobolink Dr
- 9977 Western Ridge Way
- 10114 N Whimbrel Cir
- 9972 Western Ridge Way
- 16731 Foursquare Dr
- 16859 Blackberry Lily Ln
- 16916 Tableland Trail
- 9976 Cassowary Dr
- 9881 Youpon Ridge Way
- 16373 Olive Sparrow Dr
- 9915 Valance Way
- 16742 Fallen Timbers Dr
- 16730 Fallen Timbers Dr
- 16746 Fallen Timbers Dr
- 16735 Fallen Timbers Dr
- 16750 Fallen Timbers Dr
- 16731 Fallen Timbers Dr
- 16747 Fallen Timbers Dr
- 10156 Woodhollow Dr
- 10138 Woodhollow Dr
- 16751 Fallen Timbers Dr
- 16754 Fallen Timbers Dr
- 10122 Woodhollow Dr
- 16755 Fallen Timbers Dr
- 16736 Northern Flicker Trail
- 16740 Northern Flicker Trail
- 16758 Fallen Timbers Dr
- 9899 Swallow Dr
- 16744 Northern Flicker Trail
- 16755 N Thrasher Dr
- 16759 Fallen Timbers Dr