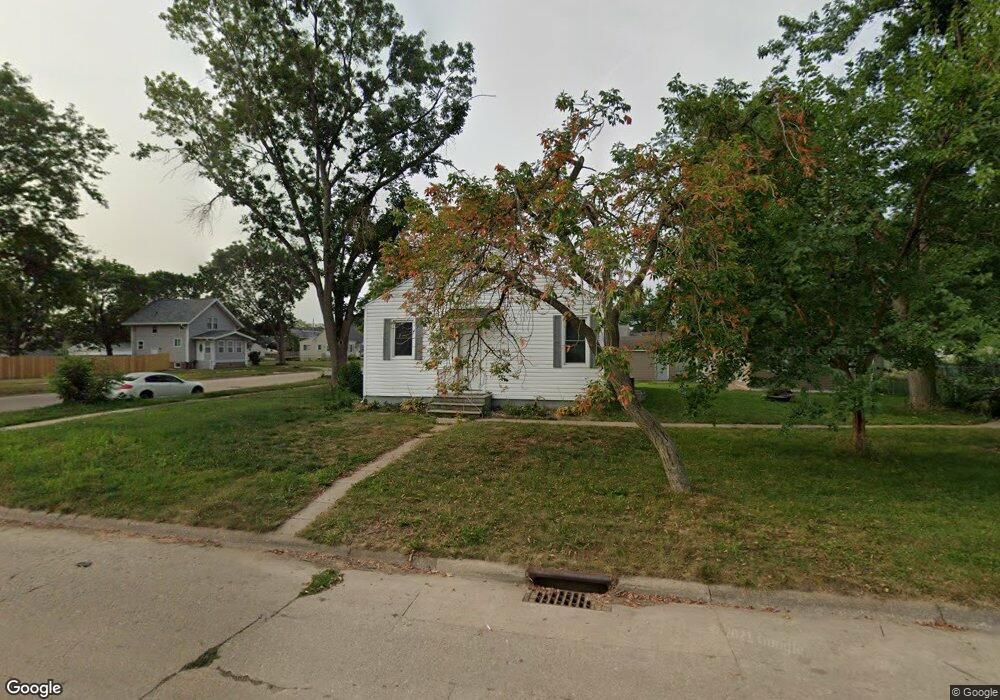
1674 8th St NW Cedar Rapids, IA 52405
Northwest Area NeighborhoodEstimated Value: $149,000 - $171,000
4
Beds
1
Bath
768
Sq Ft
$208/Sq Ft
Est. Value
About This Home
This home is located at 1674 8th St NW, Cedar Rapids, IA 52405 and is currently estimated at $159,500, approximately $207 per square foot. 1674 8th St NW is a home with nearby schools including Harrison Elementary School, Kentucky Tech - Ashland Reg Tech Center, and Ponderosa Elementary School.
Ownership History
Date
Name
Owned For
Owner Type
Purchase Details
Closed on
Jan 29, 2010
Sold by
King Rhonda Rae
Bought by
Scallon Custom Homes Llc
Current Estimated Value
Purchase Details
Closed on
Aug 9, 2005
Sold by
Hud
Bought by
King Rhonda Rae
Purchase Details
Closed on
May 12, 2005
Sold by
Countrywide Home Loans Inc
Bought by
Hud
Purchase Details
Closed on
Mar 22, 2005
Sold by
Barnard Glenna Sue P
Bought by
Countrywide Home Loans Inc and Countrywide Funding Corp
Purchase Details
Closed on
May 16, 1999
Sold by
Jedlicka Leo and Jedlicka Faye
Bought by
Barnard Glenna Sue P
Home Financials for this Owner
Home Financials are based on the most recent Mortgage that was taken out on this home.
Original Mortgage
$74,461
Interest Rate
6.92%
Mortgage Type
FHA
Create a Home Valuation Report for This Property
The Home Valuation Report is an in-depth analysis detailing your home's value as well as a comparison with similar homes in the area
Home Values in the Area
Average Home Value in this Area
Purchase History
| Date | Buyer | Sale Price | Title Company |
|---|---|---|---|
| Scallon Custom Homes Llc | $29,500 | None Available | |
| King Rhonda Rae | -- | -- | |
| Hud | -- | -- | |
| Countrywide Home Loans Inc | $82,474 | -- | |
| Barnard Glenna Sue P | $74,000 | -- |
Source: Public Records
Mortgage History
| Date | Status | Borrower | Loan Amount |
|---|---|---|---|
| Previous Owner | Barnard Glenna Sue P | $74,461 |
Source: Public Records
Tax History Compared to Growth
Tax History
| Year | Tax Paid | Tax Assessment Tax Assessment Total Assessment is a certain percentage of the fair market value that is determined by local assessors to be the total taxable value of land and additions on the property. | Land | Improvement |
|---|---|---|---|---|
| 2025 | $2,396 | $148,500 | $32,100 | $116,400 |
| 2024 | $2,466 | $135,400 | $26,700 | $108,700 |
| 2023 | $2,466 | $135,400 | $26,700 | $108,700 |
| 2022 | $2,368 | $116,900 | $26,700 | $90,200 |
| 2021 | $2,346 | $114,300 | $24,100 | $90,200 |
| 2020 | $2,346 | $106,300 | $24,100 | $82,200 |
| 2019 | $1,990 | $96,700 | $21,400 | $75,300 |
| 2018 | $1,866 | $92,300 | $21,400 | $70,900 |
| 2017 | $1,866 | $88,500 | $21,400 | $67,100 |
| 2016 | $1,834 | $86,300 | $21,400 | $64,900 |
| 2015 | $1,748 | $82,114 | $21,384 | $60,730 |
| 2014 | $1,748 | $62,124 | $21,384 | $40,740 |
| 2013 | $1,294 | $62,124 | $21,384 | $40,740 |
Source: Public Records
Map
Nearby Homes
- 820 M Ave NW
- 1871 Ellis Blvd NW Unit 202
- 1871 Ellis Blvd NW Unit 205
- 1238 Ellis Blvd NW
- 1222 8th St NW
- 1424 N Ave NW
- 1130 13th St NW
- 1624 O Ave NW
- 1126 13th St NW
- 1724 O Ave NW
- 1016 H Ave NW
- 816 9th St NW
- 1015 Pawnee Dr NW
- 0 O Ave NW
- 819 G Ave NW
- 716 F Ave NW
- 1073 G Ave NW
- 718 4th St NW
- 2218 Tranquil Ct NW
- 720 E Ave NW
- 1668 8th St NW
- 1658 8th St NW
- 1675 9th St NW
- 1706 8th St NW
- 1669 9th St NW
- 1665 8th St NW
- 1661 9th St NW
- 1701 8th St NW
- 1712 8th St NW
- 822 Penn Ave NW
- 1653 9th St NW
- 1648 8th St NW
- 714 Penn Ave NW
- 1646 8th St NW
- 1653 8th St NW
- 1715 9th St NW
- 1645 9th St NW
- 1642 8th St NW
- 1722 8th St NW
- 1668 Ellis Blvd NW