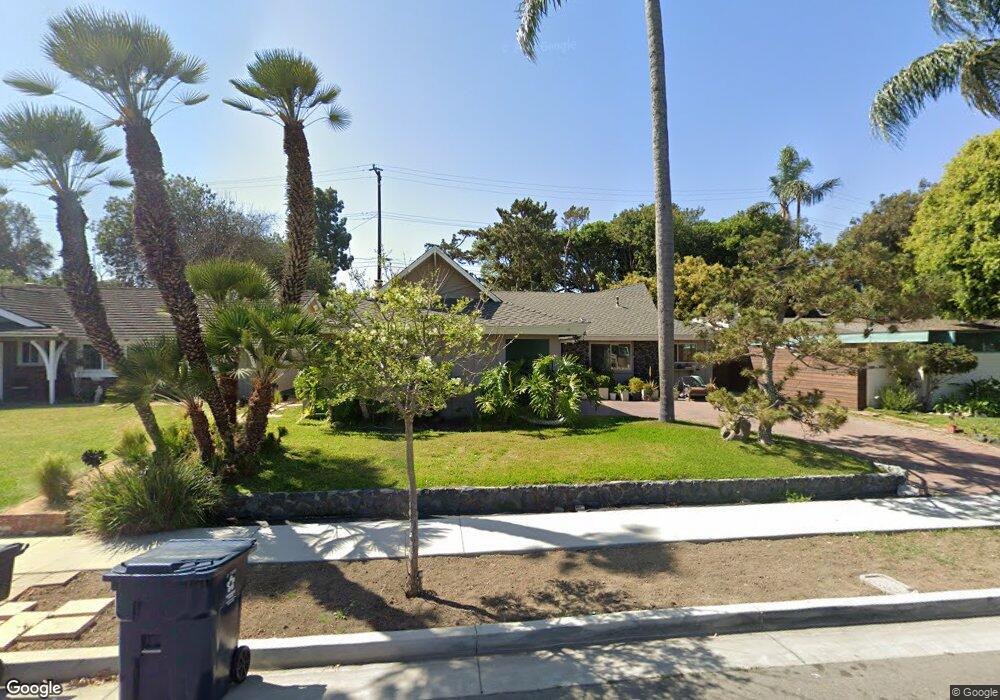
16751 Greenview Ln Huntington Beach, CA 92649
Estimated Value: $1,149,000 - $1,247,952
4
Beds
2
Baths
1,523
Sq Ft
$787/Sq Ft
Est. Value
About This Home
This home is located at 16751 Greenview Ln, Huntington Beach, CA 92649 and is currently estimated at $1,198,738, approximately $787 per square foot. 16751 Greenview Ln is a home located in Orange County with nearby schools including Circle View Elementary School, Spring View Middle School, and Marina High School.
Ownership History
Date
Name
Owned For
Owner Type
Purchase Details
Closed on
Apr 20, 2015
Sold by
Maxwell David J
Bought by
Maxwell Mary Jane
Current Estimated Value
Home Financials for this Owner
Home Financials are based on the most recent Mortgage that was taken out on this home.
Original Mortgage
$400,000
Outstanding Balance
$307,815
Interest Rate
3.73%
Mortgage Type
New Conventional
Estimated Equity
$890,923
Purchase Details
Closed on
Jan 6, 1994
Sold by
Maxwell Kenneth E
Bought by
Maxwell Kenneth E
Home Financials for this Owner
Home Financials are based on the most recent Mortgage that was taken out on this home.
Original Mortgage
$66,000
Interest Rate
6.91%
Purchase Details
Closed on
Nov 8, 1993
Sold by
Maxwell Kenneth E
Bought by
Maxwell Kenneth E
Home Financials for this Owner
Home Financials are based on the most recent Mortgage that was taken out on this home.
Original Mortgage
$66,000
Interest Rate
6.91%
Create a Home Valuation Report for This Property
The Home Valuation Report is an in-depth analysis detailing your home's value as well as a comparison with similar homes in the area
Home Values in the Area
Average Home Value in this Area
Purchase History
| Date | Buyer | Sale Price | Title Company |
|---|---|---|---|
| Maxwell Mary Jane | -- | Wfg Title Company | |
| Maxwell Kenneth E | -- | -- | |
| Maxwell Kenneth E | -- | Orange Coast Title |
Source: Public Records
Mortgage History
| Date | Status | Borrower | Loan Amount |
|---|---|---|---|
| Open | Maxwell Mary Jane | $400,000 | |
| Previous Owner | Maxwell Kenneth E | $66,000 |
Source: Public Records
Tax History Compared to Growth
Tax History
| Year | Tax Paid | Tax Assessment Tax Assessment Total Assessment is a certain percentage of the fair market value that is determined by local assessors to be the total taxable value of land and additions on the property. | Land | Improvement |
|---|---|---|---|---|
| 2025 | $1,454 | $106,045 | $40,488 | $65,557 |
| 2024 | $1,454 | $103,966 | $39,694 | $64,272 |
| 2023 | $1,416 | $101,928 | $38,916 | $63,012 |
| 2022 | $1,389 | $99,930 | $38,153 | $61,777 |
| 2021 | $1,364 | $97,971 | $37,405 | $60,566 |
| 2020 | $1,348 | $96,967 | $37,022 | $59,945 |
| 2019 | $1,328 | $95,066 | $36,296 | $58,770 |
| 2018 | $1,300 | $93,202 | $35,584 | $57,618 |
| 2017 | $1,279 | $91,375 | $34,886 | $56,489 |
| 2016 | $1,234 | $89,584 | $34,202 | $55,382 |
| 2015 | $1,213 | $88,239 | $33,688 | $54,551 |
| 2014 | -- | $86,511 | $33,028 | $53,483 |
Source: Public Records
Map
Nearby Homes
- 16542 Los Verdes Ln
- 16652 Busby Ln
- 6171 Gumm Dr
- 5591 Heil Ave
- 17042 Twain Ln
- 6051 Summerdale Dr
- 17071 Pinehurst Ln
- 6292 Heil Ave
- 16261 Angler Ln
- 6301 Warner Ave Unit 88
- 6301 Warner Ave Unit 40
- 6351 Gloria Dr
- 17301 Juniper Ln
- 16401 Mercier Ln
- 17231 Lido Ln
- 5200 Heil Ave Unit 18
- 5200 Heil Ave Unit 8
- 16832 Roosevelt Ln
- 5262 Glenroy Dr
- 5241 Glenroy Dr
- 16741 Greenview Ln
- 16761 Greenview Ln
- 16771 Greenview Ln
- 16731 Greenview Ln
- 5891 Edmonds Cir
- 16791 Greenview Ln
- 16721 Greenview Ln
- 5892 Edmonds Cir
- 5892 Franmar Cir
- 5901 Edmonds Cir
- 5902 Edmonds Cir
- 16801 Greenview Ln
- 16711 Greenview Ln
- 5891 Gildred Cir
- 5902 Franmar Cir
- 5911 Edmonds Cir
- 5912 Edmonds Cir
- 5901 Gildred Cir
- 16811 Greenview Ln
- 16701 Greenview Ln