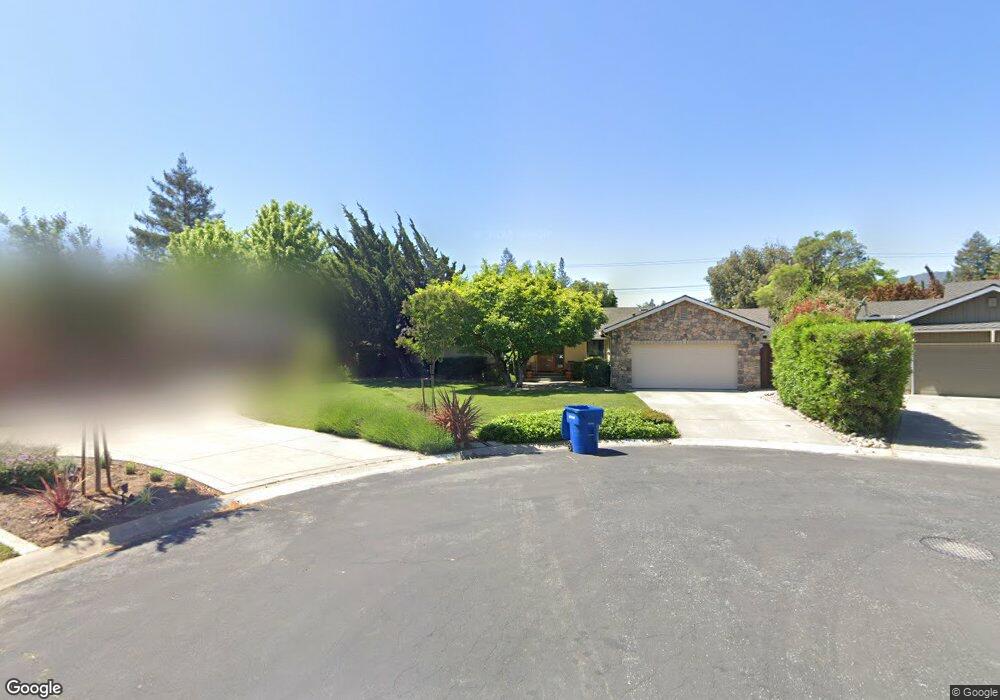
16754 Corcel Ct Los Gatos, CA 95032
East Los Gatos NeighborhoodEstimated Value: $3,253,000 - $3,310,000
3
Beds
4
Baths
1,605
Sq Ft
$2,043/Sq Ft
Est. Value
About This Home
This home is located at 16754 Corcel Ct, Los Gatos, CA 95032 and is currently estimated at $3,278,924, approximately $2,042 per square foot. 16754 Corcel Ct is a home located in Santa Clara County with nearby schools including Louise Van Meter Elementary School, Loma Prieta Elementary School, and Raymond J. Fisher Middle School.
Ownership History
Date
Name
Owned For
Owner Type
Purchase Details
Closed on
Feb 20, 2013
Sold by
Page Michael A and Page Barbara M
Bought by
Page Barbara M and Page Michael A
Current Estimated Value
Home Financials for this Owner
Home Financials are based on the most recent Mortgage that was taken out on this home.
Original Mortgage
$399,000
Outstanding Balance
$78,582
Interest Rate
3.36%
Mortgage Type
New Conventional
Estimated Equity
$3,200,342
Purchase Details
Closed on
Aug 27, 2001
Sold by
Page Michael and Brown Barbara
Bought by
Page Michael and Page Barbara
Home Financials for this Owner
Home Financials are based on the most recent Mortgage that was taken out on this home.
Original Mortgage
$620,000
Interest Rate
6.37%
Purchase Details
Closed on
May 4, 2000
Sold by
Clark John G and Clark Eugenia K
Bought by
Page Michael and Brown Barbara
Home Financials for this Owner
Home Financials are based on the most recent Mortgage that was taken out on this home.
Original Mortgage
$600,000
Interest Rate
7.8%
Create a Home Valuation Report for This Property
The Home Valuation Report is an in-depth analysis detailing your home's value as well as a comparison with similar homes in the area
Home Values in the Area
Average Home Value in this Area
Purchase History
| Date | Buyer | Sale Price | Title Company |
|---|---|---|---|
| Page Barbara M | -- | Chicago Title Company | |
| Page Michael | -- | Commonwealth Land Title | |
| Page Michael | $1,000,000 | North American Title Co |
Source: Public Records
Mortgage History
| Date | Status | Borrower | Loan Amount |
|---|---|---|---|
| Open | Page Barbara M | $399,000 | |
| Closed | Page Michael | $620,000 | |
| Closed | Page Michael | $600,000 |
Source: Public Records
Tax History Compared to Growth
Tax History
| Year | Tax Paid | Tax Assessment Tax Assessment Total Assessment is a certain percentage of the fair market value that is determined by local assessors to be the total taxable value of land and additions on the property. | Land | Improvement |
|---|---|---|---|---|
| 2025 | $18,772 | $1,590,540 | $1,037,457 | $553,083 |
| 2024 | $18,772 | $1,559,354 | $1,017,115 | $542,239 |
| 2023 | $18,772 | $1,528,779 | $997,172 | $531,607 |
| 2022 | $18,307 | $1,498,804 | $977,620 | $521,184 |
| 2021 | $17,764 | $1,449,808 | $958,451 | $491,357 |
| 2020 | $17,445 | $1,434,943 | $948,624 | $486,319 |
| 2019 | $17,204 | $1,406,808 | $930,024 | $476,784 |
| 2018 | $16,632 | $1,350,793 | $911,789 | $439,004 |
| 2017 | $16,586 | $1,324,308 | $893,911 | $430,397 |
| 2016 | $16,153 | $1,298,342 | $876,384 | $421,958 |
| 2015 | $16,046 | $1,278,840 | $863,220 | $415,620 |
| 2014 | $15,799 | $1,253,790 | $846,311 | $407,479 |
Source: Public Records
Map
Nearby Homes
- 120 Carlton Ave Unit 22
- 209 Nob Hill Way
- 16760 Magneson Loop
- 15021 Briggs Ct
- 706 Winchester Blvd
- 16100 Jasmine Way
- 16281 Camino Del Sol
- 696 N Santa Cruz Ave
- 15360 Karl Ave
- 20 Mariposa Ave
- 216 San Mateo Ave
- 115 Lansberry Ct
- 220 Milbrae Ln Unit 6
- 449 Alberto Way Unit C139
- 451 Alberto Way Unit 151
- 16460 B Bonnie Ln
- 443 Alberto Way Unit B115
- 443 Alberto Way Unit B121
- 14685 Oka Rd Unit 28
- 15560 Camino Del Cerro
- 16761 Corcel Ct
- 16768 Corcel Ct
- 16829 Farley Rd
- 16843 Farley Rd
- 16771 Corcel Ct
- 16815 Farley Rd
- 16786 Corcel Ct
- 16857 Farley Rd
- 16803 Farley Rd
- 15616 Flintridge Dr
- 16781 Corcel Ct
- 15596 Flintridge Dr
- 16871 Farley Rd
- 16793 Farley Rd
- 16830 Farley Rd
- 16850 Farley Rd
- 15724 Izorah Way
- 16791 Corcel Ct
- 16860 Farley Rd
- 16801 Corcel Ct