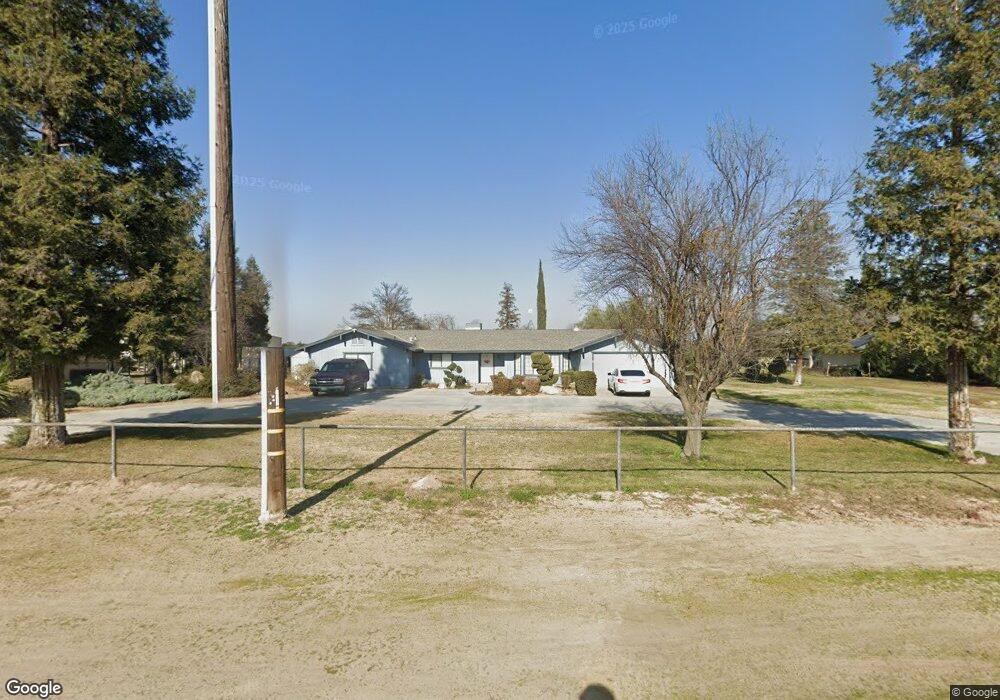
1676 E Jefferson Ave Fresno, CA 93725
Estimated Value: $514,000 - $641,000
4
Beds
2
Baths
2,180
Sq Ft
$270/Sq Ft
Est. Value
About This Home
This home is located at 1676 E Jefferson Ave, Fresno, CA 93725 and is currently estimated at $588,006, approximately $269 per square foot. 1676 E Jefferson Ave is a home located in Fresno County with nearby schools including Orange Center Elementary and Washington High School.
Ownership History
Date
Name
Owned For
Owner Type
Purchase Details
Closed on
May 17, 2024
Sold by
Santivanez Carlos and Santivanez Jill
Bought by
Santivanez Jill
Current Estimated Value
Purchase Details
Closed on
Jul 18, 2006
Sold by
Santivanez Carlos and Santivanez Jill
Bought by
Santivanez Carlos and Santivanez Jill L
Purchase Details
Closed on
Mar 3, 2005
Sold by
Santivanez Jill and Setencich Jill L
Bought by
Santivanez Carlos and Santivanez Jill
Purchase Details
Closed on
Nov 18, 1997
Sold by
Correia Randall L
Bought by
Setencich Jill L
Purchase Details
Closed on
Jun 9, 1995
Sold by
Cole Brian C
Bought by
Correia Randall L and Setencich Jill L
Home Financials for this Owner
Home Financials are based on the most recent Mortgage that was taken out on this home.
Original Mortgage
$127,300
Interest Rate
7.74%
Create a Home Valuation Report for This Property
The Home Valuation Report is an in-depth analysis detailing your home's value as well as a comparison with similar homes in the area
Home Values in the Area
Average Home Value in this Area
Purchase History
| Date | Buyer | Sale Price | Title Company |
|---|---|---|---|
| Santivanez Jill | -- | None Listed On Document | |
| Santivanez Carlos | -- | None Available | |
| Santivanez Carlos | -- | Chicago Title Company | |
| Setencich Jill L | -- | -- | |
| Correia Randall L | $134,000 | Chicago Title Company |
Source: Public Records
Mortgage History
| Date | Status | Borrower | Loan Amount |
|---|---|---|---|
| Previous Owner | Correia Randall L | $127,300 |
Source: Public Records
Tax History Compared to Growth
Tax History
| Year | Tax Paid | Tax Assessment Tax Assessment Total Assessment is a certain percentage of the fair market value that is determined by local assessors to be the total taxable value of land and additions on the property. | Land | Improvement |
|---|---|---|---|---|
| 2025 | $2,554 | $220,637 | $67,525 | $153,112 |
| 2023 | $2,554 | $212,070 | $64,903 | $147,167 |
| 2022 | $2,385 | $207,913 | $63,631 | $144,282 |
| 2021 | $2,344 | $203,837 | $62,384 | $141,453 |
| 2020 | $2,205 | $201,748 | $61,745 | $140,003 |
| 2019 | $2,169 | $197,793 | $60,535 | $137,258 |
| 2018 | $2,131 | $193,916 | $59,349 | $134,567 |
| 2017 | $2,078 | $190,115 | $58,186 | $131,929 |
| 2016 | $2,033 | $186,389 | $57,046 | $129,343 |
| 2015 | $1,985 | $183,591 | $56,190 | $127,401 |
| 2014 | $1,950 | $179,996 | $55,090 | $124,906 |
Source: Public Records
Map
Nearby Homes
- 120 Lot Rd
- 5942 S Cedar Ave
- 0 S Maple Ave Unit 626629
- 4637 S Maple Ave
- 5938 S Cherry Ave
- 6102 S Cherry Ave
- 102 E Willamette Ave
- 3415 E Lincoln Ave
- 4711 S Elm Ave
- 3641 S Cherry Ave
- 7265 S Chestnut Ave
- 3055 E Olney Ave
- 256 W Clayton Ave
- 5525 S Fig Ave
- 3646 S Harding Ave
- 2801 E American Ave
- 3271 E Muscat Ave
- 6394 S Cherry Ave
- 162 E South Ave
- 3232 S Elm Ave
- 1632 E Jefferson Ave
- 1708 E Jefferson Ave
- 1608 E Jefferson Ave
- 1801 E Jefferson Ave
- 1607 E Jefferson Ave
- 1857 E Jefferson Ave
- 5405 S Orange Ave
- 5719 S Cedar Ave
- 5437 S Cedar Ave
- 5379 S Cedar Ave
- 5161 S Cedar Ave
- 5245 S Cedar Ave
- 5130 S Orange Ave
- 5215 S Orange Ave
- 5157 S Cedar Ave
- 5755 S Orange Ave
- 5173 S Orange Ave
- 5167 S Cedar Ave
- 5828 S Orange Ave
- 5137 S Cedar Ave