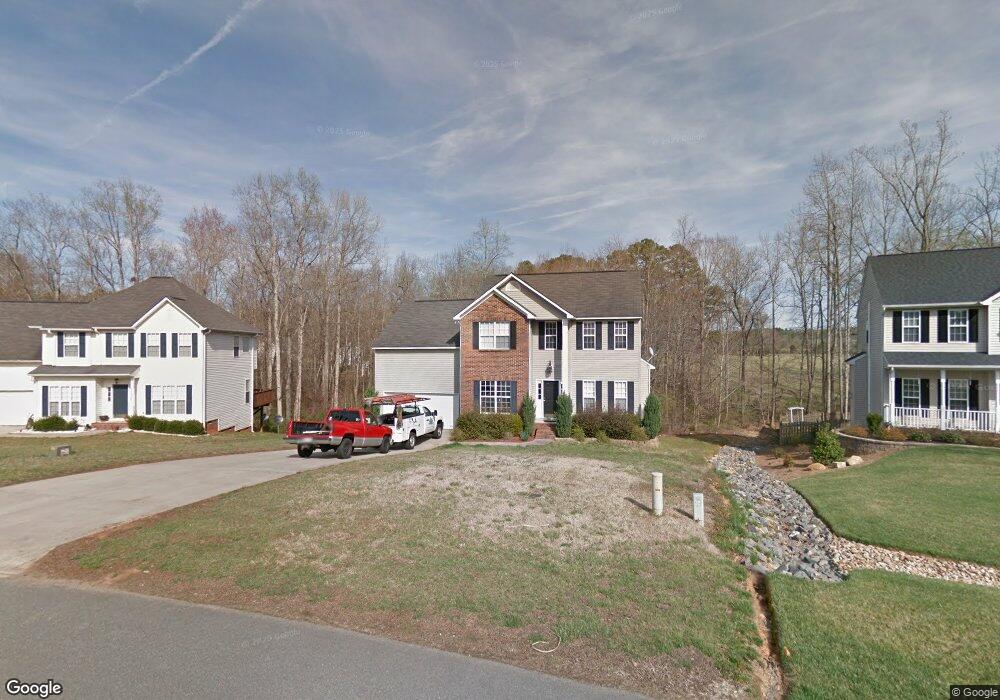
1676 Trotters Ridge Rd Stanfield, NC 28163
Estimated Value: $373,000 - $446,000
5
Beds
3
Baths
2,281
Sq Ft
$179/Sq Ft
Est. Value
About This Home
This home is located at 1676 Trotters Ridge Rd, Stanfield, NC 28163 and is currently estimated at $407,593, approximately $178 per square foot. 1676 Trotters Ridge Rd is a home located in Stanly County with nearby schools including Stanfield Elementary School, West Stanly Middle School, and West Stanly High School.
Ownership History
Date
Name
Owned For
Owner Type
Purchase Details
Closed on
Jul 19, 2017
Sold by
Speights Joseph Dustin
Bought by
Clark Rachel V and Speights Rachel V
Current Estimated Value
Purchase Details
Closed on
Jun 29, 2007
Sold by
Robertson Randall K and Robertson Dana M
Bought by
Speights Joseh Dustin and Speights Rachel
Home Financials for this Owner
Home Financials are based on the most recent Mortgage that was taken out on this home.
Original Mortgage
$181,520
Outstanding Balance
$111,426
Interest Rate
6.16%
Mortgage Type
FHA
Estimated Equity
$296,167
Purchase Details
Closed on
Apr 24, 2006
Sold by
Bochino Laurie A and Bochino Laurie Cain
Bought by
Robertson Randall K and Robertson Dana M
Home Financials for this Owner
Home Financials are based on the most recent Mortgage that was taken out on this home.
Original Mortgage
$157,528
Interest Rate
6.31%
Mortgage Type
FHA
Create a Home Valuation Report for This Property
The Home Valuation Report is an in-depth analysis detailing your home's value as well as a comparison with similar homes in the area
Home Values in the Area
Average Home Value in this Area
Purchase History
| Date | Buyer | Sale Price | Title Company |
|---|---|---|---|
| Clark Rachel V | -- | None Available | |
| Speights Joseh Dustin | $184,500 | None Available | |
| Robertson Randall K | $160,000 | None Available |
Source: Public Records
Mortgage History
| Date | Status | Borrower | Loan Amount |
|---|---|---|---|
| Open | Speights Joseh Dustin | $181,520 | |
| Previous Owner | Robertson Randall K | $157,528 |
Source: Public Records
Tax History Compared to Growth
Tax History
| Year | Tax Paid | Tax Assessment Tax Assessment Total Assessment is a certain percentage of the fair market value that is determined by local assessors to be the total taxable value of land and additions on the property. | Land | Improvement |
|---|---|---|---|---|
| 2025 | $2,880 | $296,930 | $45,630 | $251,300 |
| 2024 | $2,259 | $211,162 | $28,080 | $183,082 |
| 2023 | $2,154 | $211,162 | $28,080 | $183,082 |
| 2022 | $2,154 | $211,162 | $28,080 | $183,082 |
| 2021 | $2,154 | $211,162 | $28,080 | $183,082 |
| 2020 | $1,936 | $181,034 | $22,815 | $158,219 |
| 2019 | $1,955 | $181,034 | $22,815 | $158,219 |
| 2018 | $1,955 | $181,034 | $22,815 | $158,219 |
| 2017 | $1,955 | $181,034 | $22,815 | $158,219 |
| 2016 | $1,897 | $175,651 | $21,060 | $154,591 |
| 2015 | $1,916 | $175,651 | $21,060 | $154,591 |
| 2014 | $1,880 | $175,651 | $21,060 | $154,591 |
Source: Public Records
Map
Nearby Homes
- 133 Stonewater Dr Unit 16p
- 165 Stonewater Dr Unit 3p
- 163 Stonewater Dr Unit 4p
- TA3000 Plan at Streamside
- Declan Plan at Streamside
- TA1800 Plan at Streamside
- TA4000 Plan at Streamside
- Lenox Plan at Streamside
- Bayside Plan at Streamside
- Hudson Plan at Streamside
- Whitney Plan at Streamside
- 167 Stonewater Dr Unit 2p
- 164 Stonewater Dr Unit 53p
- 241 Streamside Dr Unit 76
- 485 Hilltop Rd
- 1976 Ethan Ln
- 159 Rubys Way Unit 35
- 1974 Redwood Dr
- 621 Big Lick Rd
- 565 Wade Rd
- 1670 Trotters Ridge Rd
- 1682 Trotters Ridge Rd
- 1664 Trotters Ridge Rd
- 1688 Trotters Ridge Rd
- 1605 Rosegate Ln
- 1605 Rosegate Ln Unit 11A
- 1663 Trotters Ridge Rd
- 1677 Trotters Ridge Rd
- 1658 Trotters Ridge Rd
- 1638 Trotters Ridge Rd
- 1611 Rosegate Ln
- 1657 Trotters Ridge Rd
- 1689 Trotters Ridge Rd
- 1702 Trotters Ridge Rd
- 1652 Trotters Ridge Rd
- 1619 Rosegate Ln
- 1602 Rosegate Ln
- 1651 Trotters Ridge Rd
- 1697 Trotters Ridge Rd
- 1710 Trotters Ridge Rd