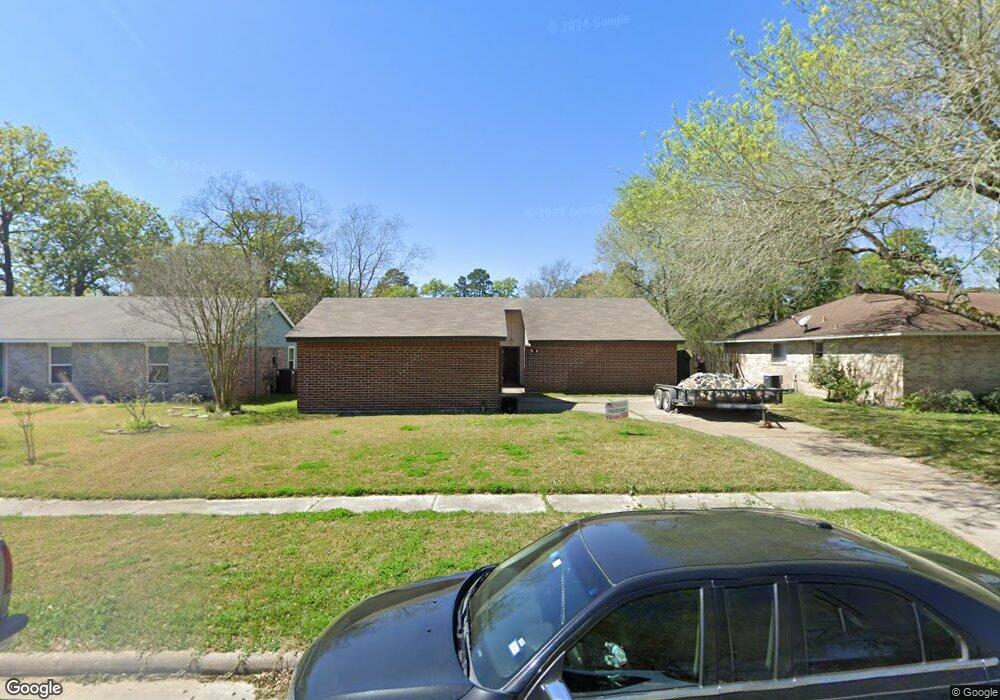
16762 Gleneagle Dr N Conroe, TX 77385
Estimated Value: $220,322 - $235,000
3
Beds
2
Baths
1,655
Sq Ft
$138/Sq Ft
Est. Value
About This Home
This home is located at 16762 Gleneagle Dr N, Conroe, TX 77385 and is currently estimated at $228,081, approximately $137 per square foot. 16762 Gleneagle Dr N is a home located in Montgomery County with nearby schools including Oak Ridge Elementary School, Irons J High School, and Vogel Intermediate School.
Ownership History
Date
Name
Owned For
Owner Type
Purchase Details
Closed on
Feb 27, 2012
Sold by
Dawson Christopher W and Dawson Ashley
Bought by
Gonzalez John
Current Estimated Value
Home Financials for this Owner
Home Financials are based on the most recent Mortgage that was taken out on this home.
Original Mortgage
$97,367
Outstanding Balance
$66,500
Interest Rate
3.75%
Mortgage Type
FHA
Estimated Equity
$161,581
Purchase Details
Closed on
Sep 28, 2006
Sold by
Chapa Nury A
Bought by
Dawson Christopher W
Home Financials for this Owner
Home Financials are based on the most recent Mortgage that was taken out on this home.
Original Mortgage
$95,510
Interest Rate
6.51%
Mortgage Type
VA
Purchase Details
Closed on
Apr 20, 1992
Sold by
Adm Of Veterans Affairs
Bought by
Gonzalez John
Create a Home Valuation Report for This Property
The Home Valuation Report is an in-depth analysis detailing your home's value as well as a comparison with similar homes in the area
Home Values in the Area
Average Home Value in this Area
Purchase History
| Date | Buyer | Sale Price | Title Company |
|---|---|---|---|
| Gonzalez John | -- | Old Republic Title | |
| Dawson Christopher W | -- | Chicago Title | |
| Gonzalez John | -- | -- |
Source: Public Records
Mortgage History
| Date | Status | Borrower | Loan Amount |
|---|---|---|---|
| Open | Gonzalez John | $97,367 | |
| Previous Owner | Dawson Christopher W | $95,510 |
Source: Public Records
Tax History Compared to Growth
Tax History
| Year | Tax Paid | Tax Assessment Tax Assessment Total Assessment is a certain percentage of the fair market value that is determined by local assessors to be the total taxable value of land and additions on the property. | Land | Improvement |
|---|---|---|---|---|
| 2025 | $2,840 | $182,072 | $32,480 | $149,592 |
| 2024 | $2,621 | $189,558 | $32,480 | $157,078 |
| 2023 | $2,621 | $178,950 | $32,480 | $163,040 |
| 2022 | $3,337 | $162,680 | $32,480 | $153,990 |
| 2021 | $3,858 | $147,890 | $32,480 | $115,410 |
| 2020 | $3,929 | $142,440 | $32,480 | $113,460 |
| 2019 | $3,735 | $129,490 | $18,560 | $110,930 |
| 2018 | $2,787 | $119,490 | $18,560 | $100,930 |
| 2017 | $3,469 | $118,050 | $18,560 | $100,930 |
| 2016 | $3,154 | $107,320 | $18,560 | $89,250 |
| 2015 | $2,451 | $97,560 | $18,560 | $94,070 |
| 2014 | $2,451 | $88,690 | $18,560 | $75,610 |
Source: Public Records
Map
Nearby Homes
- 9838 Bobolink Dr
- 9921 Kingfisher Dr
- 74 Wimberly Way
- 16751 N Rail Dr
- 16771 N Rail Dr
- 16731 Foursquare Dr
- 16778 N Gull Dr
- 9877 Lace Flower Way
- 9807 Toucan Ln
- 16774 Fallen Timbers Dr
- 123 Genesee Ridge Dr
- 16859 Blackberry Lily Ln
- 183 Fairwind Trail Dr
- 16937 Larkspur
- 10311 Woodhollow Dr
- 16916 Tableland Trail
- 16957 Glen Eagle Dr
- 10003 S Whimbrel Cir
- 3420 Chestnut Colony Ct
- 9881 Youpon Ridge Way
- 16766 Gleneagle Dr N
- 16758 Gleneagle Dr N
- 16754 Gleneagle Dr N
- 16770 Gleneagle Dr N
- 9803 Moa Ct
- 16752 Gleneagle Dr N
- 16774 Gleneagle Dr N
- 9802 Moa Ct
- 9800 Ibis Ln
- 16750 Gleneagle Dr N
- 16778 Gleneagle Dr N
- 9807 Moa Ct
- 9806 Moa Ct
- 9804 Ibis Ln
- 16777 Gleneagle Dr N
- 16746 Gleneagle Dr N
- 16782 Gleneagle Dr N
- 9810 Moa Ct
- 18 Snow Woods Ct
- 14 Snow Woods Ct