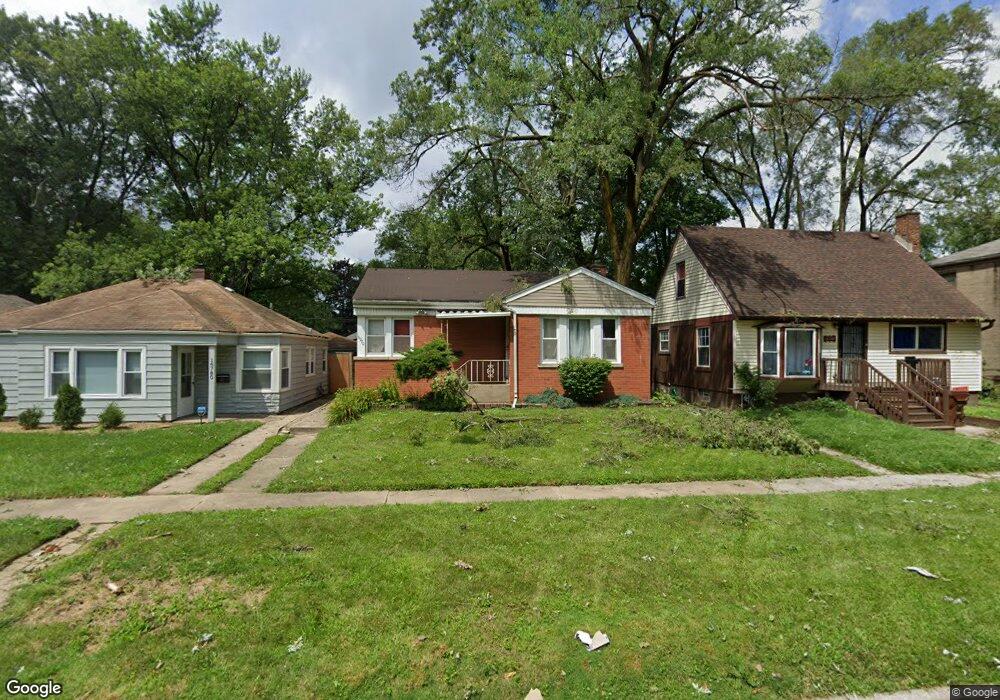
16764 Head Ave Hazel Crest, IL 60429
Hazel Crest Proper NeighborhoodEstimated Value: $159,000 - $247,000
3
Beds
2
Baths
1,155
Sq Ft
$160/Sq Ft
Est. Value
About This Home
This home is located at 16764 Head Ave, Hazel Crest, IL 60429 and is currently estimated at $185,303, approximately $160 per square foot. 16764 Head Ave is a home located in Cook County with nearby schools including Thornwood High School.
Ownership History
Date
Name
Owned For
Owner Type
Purchase Details
Closed on
May 9, 2022
Sold by
Browning Builders Inc and Browning Buildings Llc
Bought by
Smolin Mark
Current Estimated Value
Home Financials for this Owner
Home Financials are based on the most recent Mortgage that was taken out on this home.
Original Mortgage
$126,750
Interest Rate
5.1%
Mortgage Type
New Conventional
Purchase Details
Closed on
Feb 3, 2022
Sold by
Maple Real Estate Llc
Bought by
Browning Buildings Llc
Purchase Details
Closed on
Dec 20, 2021
Sold by
Maple Real Estate Llc
Bought by
Browning Buildings Llc
Purchase Details
Closed on
Nov 13, 2018
Sold by
Cook County
Bought by
Maple Real Estate Llc
Purchase Details
Closed on
Nov 1, 2006
Sold by
Joint Realty Enterprises Llc
Bought by
Baker Charles V and Baker Khaliah Smith
Home Financials for this Owner
Home Financials are based on the most recent Mortgage that was taken out on this home.
Original Mortgage
$100,000
Interest Rate
7.5%
Mortgage Type
Stand Alone First
Purchase Details
Closed on
Sep 25, 2006
Sold by
Mueller Andrew C
Bought by
Joint Realty Enterprises Llc
Home Financials for this Owner
Home Financials are based on the most recent Mortgage that was taken out on this home.
Original Mortgage
$100,000
Interest Rate
7.5%
Mortgage Type
Stand Alone First
Purchase Details
Closed on
Jun 16, 2006
Sold by
Joint Realty Enterprises Llc
Bought by
Mueller Andrew C
Purchase Details
Closed on
Sep 16, 2005
Sold by
Home Acquisitions Inc
Bought by
Joint Realty Enterprises Llc
Purchase Details
Closed on
May 3, 2005
Sold by
Thomas Christine Hill
Bought by
Home Aquisitions Inc
Purchase Details
Closed on
Feb 2, 2003
Sold by
Hill Thomas Christine
Bought by
Tarver Rochell
Purchase Details
Closed on
Oct 23, 2001
Sold by
Berry Michael
Bought by
Hill Christine
Purchase Details
Closed on
Jun 28, 1994
Sold by
Lawrence James E and Lawrence Laura
Bought by
Hill Thomas Christine
Home Financials for this Owner
Home Financials are based on the most recent Mortgage that was taken out on this home.
Original Mortgage
$61,750
Interest Rate
8.66%
Mortgage Type
FHA
Purchase Details
Closed on
Jun 13, 1994
Sold by
Va
Bought by
Lawrence James E
Home Financials for this Owner
Home Financials are based on the most recent Mortgage that was taken out on this home.
Original Mortgage
$61,750
Interest Rate
8.66%
Mortgage Type
FHA
Create a Home Valuation Report for This Property
The Home Valuation Report is an in-depth analysis detailing your home's value as well as a comparison with similar homes in the area
Home Values in the Area
Average Home Value in this Area
Purchase History
| Date | Buyer | Sale Price | Title Company |
|---|---|---|---|
| Smolin Mark | $174,000 | None Listed On Document | |
| Browning Buildings Llc | $58,000 | -- | |
| Browning Buildings Llc | $58,000 | -- | |
| Maple Real Estate Llc | -- | Attorney | |
| Baker Charles V | $125,000 | Ticor Title | |
| Joint Realty Enterprises Llc | -- | None Available | |
| Mueller Andrew C | -- | None Available | |
| Joint Realty Enterprises Llc | $80,000 | Lasalle Title | |
| Home Aquisitions Inc | $60,500 | -- | |
| Tarver Rochell | -- | Citywide Title Corporation | |
| Hill Christine | -- | -- | |
| Hill Thomas Christine | $62,000 | -- | |
| Lawrence James E | -- | -- |
Source: Public Records
Mortgage History
| Date | Status | Borrower | Loan Amount |
|---|---|---|---|
| Previous Owner | Smolin Mark | $126,750 | |
| Previous Owner | Baker Charles V | $100,000 | |
| Previous Owner | Hill Thomas Christine | $61,750 |
Source: Public Records
Tax History Compared to Growth
Tax History
| Year | Tax Paid | Tax Assessment Tax Assessment Total Assessment is a certain percentage of the fair market value that is determined by local assessors to be the total taxable value of land and additions on the property. | Land | Improvement |
|---|---|---|---|---|
| 2024 | $9,991 | $15,600 | $1,694 | $13,906 |
| 2023 | $4,311 | $15,600 | $1,694 | $13,906 |
| 2022 | $4,311 | $4,980 | $1,452 | $3,528 |
| 2021 | $1,388 | $4,980 | $1,452 | $3,528 |
| 2020 | $1,482 | $4,980 | $1,452 | $3,528 |
| 2019 | $1,973 | $5,952 | $1,331 | $4,621 |
| 2018 | $1,916 | $5,952 | $1,331 | $4,621 |
| 2017 | $1,897 | $5,952 | $1,331 | $4,621 |
| 2016 | $2,721 | $6,523 | $1,210 | $5,313 |
| 2015 | $2,557 | $6,523 | $1,210 | $5,313 |
| 2014 | $2,560 | $6,523 | $1,210 | $5,313 |
| 2013 | $2,547 | $6,943 | $1,210 | $5,733 |
Source: Public Records
Map
Nearby Homes
- 16780 Head Ave
- 16726 Head Ave
- 16784 Crane Ave
- 16727 Head Ave
- 16742 Crane Ave
- 16744 Trapet Ave
- 16876 Head Ave
- 16784 Anthony Ave
- 16768 Bulger Ave
- 16879 Head Ave
- 16840 Bulger Ave
- 16927 Crane Ave
- 16732 Orchard Ridge Ave
- 16846 Orchard Ridge Ave
- 16751 Western Ave
- 16918 Shea Ave
- 16913 Western Ave
- 16919 Western Ave
- 16969 Orchard Ridge Ave
- 2131 170th St
- 16770 Head Ave
- 16762 Head Ave
- 16750 Head Ave
- 16784 Head Ave
- 16744 Head Ave
- 16765 Crane Ave
- 16759 Crane Ave
- 16771 Crane Ave
- 16742 Head Ave
- 16751 Crane Ave
- 16781 Crane Ave
- 16785 Crane Ave
- 16765 Head Ave
- 16759 Head Ave
- 16736 Head Ave
- 16751 Head Ave
- 16781 Head Ave
- 16745 Head Ave
- 16785 Head Ave
- 16733 Crane Ave