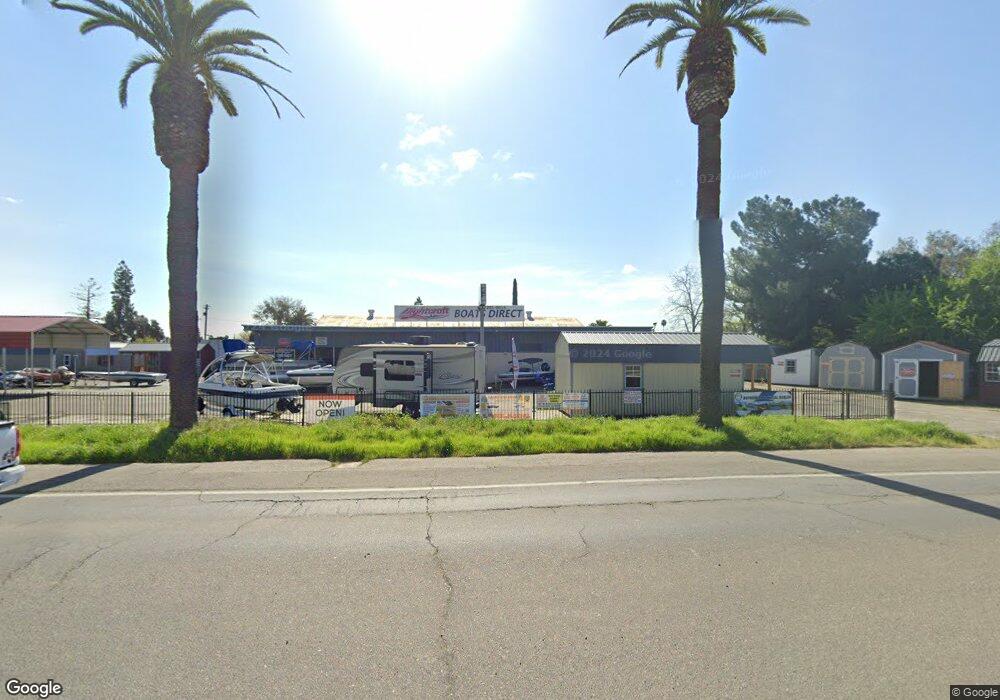
1677 Robertson Blvd Chowchilla, CA 93610
Estimated Value: $914,569
--
Bed
1
Bath
10,000
Sq Ft
$91/Sq Ft
Est. Value
About This Home
This home is located at 1677 Robertson Blvd, Chowchilla, CA 93610 and is currently estimated at $914,569, approximately $91 per square foot. 1677 Robertson Blvd is a home located in Madera County with nearby schools including Merle L. Fuller Elementary School, Stephens Elementary School, and Ronald Reagan Elementary School.
Ownership History
Date
Name
Owned For
Owner Type
Purchase Details
Closed on
Mar 8, 2024
Sold by
Collector Of Chowchilla Water District
Bought by
Grijalva Javier Ruiz and Grijalva Rosa Maria
Current Estimated Value
Purchase Details
Closed on
Jun 8, 2023
Sold by
Rosemary Spasovich Family Trust
Bought by
Grijalva Ruiz Javier and Grijalva Maria Rosa
Home Financials for this Owner
Home Financials are based on the most recent Mortgage that was taken out on this home.
Original Mortgage
$705,000
Outstanding Balance
$686,148
Interest Rate
6.39%
Mortgage Type
New Conventional
Estimated Equity
$228,421
Purchase Details
Closed on
Mar 3, 2017
Sold by
Spasovich Rosemary
Bought by
Spasovich Rosemary
Purchase Details
Closed on
Oct 8, 2009
Sold by
The Roger & Rosemary Andriesse Living Tr
Bought by
Rosemary Andriesse Separate Property Tru
Create a Home Valuation Report for This Property
The Home Valuation Report is an in-depth analysis detailing your home's value as well as a comparison with similar homes in the area
Home Values in the Area
Average Home Value in this Area
Purchase History
| Date | Buyer | Sale Price | Title Company |
|---|---|---|---|
| Grijalva Javier Ruiz | -- | -- | |
| Grijalva Ruiz Javier | $825,000 | Chicago Title Company | |
| Spasovich Rosemary | -- | None Available | |
| Spasovich Rosemary | -- | None Available | |
| Rosemary Andriesse Separate Property Tru | -- | None Available |
Source: Public Records
Mortgage History
| Date | Status | Borrower | Loan Amount |
|---|---|---|---|
| Open | Grijalva Ruiz Javier | $705,000 |
Source: Public Records
Tax History Compared to Growth
Tax History
| Year | Tax Paid | Tax Assessment Tax Assessment Total Assessment is a certain percentage of the fair market value that is determined by local assessors to be the total taxable value of land and additions on the property. | Land | Improvement |
|---|---|---|---|---|
| 2025 | $9,176 | $858,329 | $320,443 | $537,886 |
| 2023 | $9,176 | $129,550 | $23,542 | $106,008 |
| 2022 | $1,347 | $127,011 | $23,081 | $103,930 |
| 2021 | $1,328 | $124,522 | $22,629 | $101,893 |
| 2020 | $1,294 | $123,246 | $22,397 | $100,849 |
| 2019 | $1,283 | $120,830 | $21,958 | $98,872 |
| 2018 | $1,255 | $118,462 | $21,528 | $96,934 |
| 2017 | $1,235 | $116,140 | $21,106 | $95,034 |
| 2016 | $1,175 | $113,864 | $20,693 | $93,171 |
| 2015 | $1,161 | $112,155 | $20,383 | $91,772 |
| 2014 | $1,140 | $109,959 | $19,984 | $89,975 |
Source: Public Records
Map
Nearby Homes
- 41-47 Robertson Blvd
- 1 Adams Dr
- 1550 W Robertson Blvd Unit 1520
- 1550 W Robertson Blvd
- 509 Adams Dr
- 521 Adams Dr
- 424 Washington Dr
- 1404 Trinity Ave
- 105 Cedar Ct
- 41 - 47 Robertson Blvd
- 2106 Truman Dr
- 1209 Alameda Ave
- 1105 Orange Ave
- 1017 Kings Ave
- 1604 Parkridge Dr
- 309 Pine Ct
- 1112 Sonoma Ave
- 881 Gill Way
- 809 Orange Ave
- 801 Orange Ave
- 312 Vernal Dr
- 308 Vernal Dr
- 0 Washington Unit MC8056081
- 1552 Roosevelt Dr
- 1548 Roosevelt Dr
- 301 Washington Dr
- 1730 Robertson Blvd
- 1556 Roosevelt Dr
- 304 Vernal Dr
- 1544 Roosevelt Dr
- 1540 Roosevelt Dr
- 23383 Robertson Blvd
- 305 Washington Dr
- 1600 Robertson Blvd
- 300 Vernal Dr
- 1536 Roosevelt Dr
- 300 Washington Dr
- 1617 Robertson Blvd
- 1617 Robertson Blvd
- 1532 Roosevelt Dr