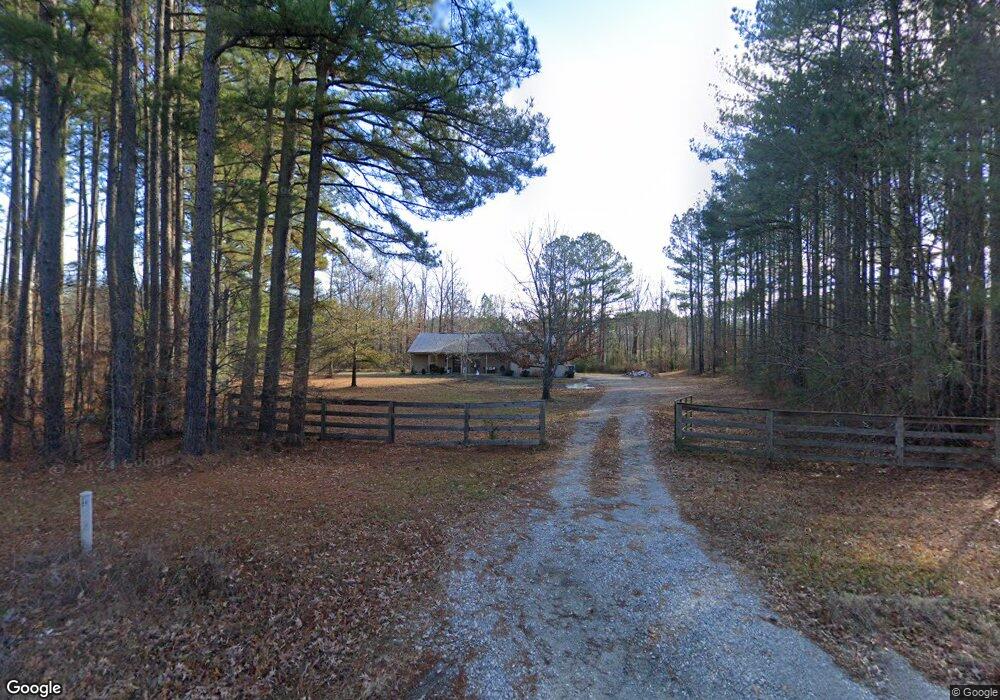
16778 Congo Ferndale Rd Little Rock, AR 72210
Estimated Value: $267,875 - $406,000
--
Bed
2
Baths
1,552
Sq Ft
$204/Sq Ft
Est. Value
About This Home
This home is located at 16778 Congo Ferndale Rd, Little Rock, AR 72210 and is currently estimated at $316,469, approximately $203 per square foot. 16778 Congo Ferndale Rd is a home located in Saline County with nearby schools including Salem Elementary School, Bethel Middle School, and Bryant Middle School.
Ownership History
Date
Name
Owned For
Owner Type
Purchase Details
Closed on
Apr 28, 2010
Sold by
Houser Robert T and Houser Alma J
Bought by
Lane Pamela J
Current Estimated Value
Home Financials for this Owner
Home Financials are based on the most recent Mortgage that was taken out on this home.
Original Mortgage
$127,500
Outstanding Balance
$84,540
Interest Rate
4.91%
Mortgage Type
New Conventional
Estimated Equity
$231,929
Purchase Details
Closed on
Jun 11, 2007
Sold by
Nalley Brett J
Bought by
Houser Robert T and Houser Alma J
Home Financials for this Owner
Home Financials are based on the most recent Mortgage that was taken out on this home.
Original Mortgage
$124,000
Interest Rate
6.15%
Mortgage Type
New Conventional
Purchase Details
Closed on
Oct 17, 2000
Bought by
Nalley
Purchase Details
Closed on
Oct 27, 1998
Bought by
Nalley
Create a Home Valuation Report for This Property
The Home Valuation Report is an in-depth analysis detailing your home's value as well as a comparison with similar homes in the area
Home Values in the Area
Average Home Value in this Area
Purchase History
| Date | Buyer | Sale Price | Title Company |
|---|---|---|---|
| Lane Pamela J | $160,000 | -- | |
| Houser Robert T | $150,000 | -- | |
| Nalley | -- | -- | |
| Nalley | $15,000 | -- | |
| Harper Di | -- | -- |
Source: Public Records
Mortgage History
| Date | Status | Borrower | Loan Amount |
|---|---|---|---|
| Open | Lane Pamela J | $127,500 | |
| Previous Owner | Houser Robert T | $124,000 |
Source: Public Records
Tax History Compared to Growth
Tax History
| Year | Tax Paid | Tax Assessment Tax Assessment Total Assessment is a certain percentage of the fair market value that is determined by local assessors to be the total taxable value of land and additions on the property. | Land | Improvement |
|---|---|---|---|---|
| 2025 | $1,613 | $40,557 | $10,800 | $29,757 |
| 2024 | $1,504 | $40,557 | $10,800 | $29,757 |
| 2023 | $1,283 | $40,557 | $10,800 | $29,757 |
| 2022 | $1,288 | $40,557 | $10,800 | $29,757 |
| 2021 | $1,294 | $32,410 | $9,000 | $23,410 |
| 2020 | $1,294 | $32,410 | $9,000 | $23,410 |
| 2019 | $1,294 | $32,410 | $9,000 | $23,410 |
| 2018 | $1,319 | $32,410 | $9,000 | $23,410 |
| 2017 | $1,245 | $32,410 | $9,000 | $23,410 |
| 2016 | $1,367 | $29,140 | $7,600 | $21,540 |
| 2015 | $1,367 | $29,140 | $7,600 | $21,540 |
| 2014 | $1,017 | $29,140 | $7,600 | $21,540 |
Source: Public Records
Map
Nearby Homes
- 220 W Lawson Rd
- 2091 Ferndale Cove
- 1560 Lawson Oaks Dr
- 457 Judah Ln
- 14800 Congo Ferndale Rd
- 1516 E Lawson Rd Unit 1512
- 000 Big Ridge Cove
- 464 Reuben Dr
- 544 Reuben Dr
- 466 Rock Ridge Rd
- 000 W Colonel Glenn Rd
- 1100 Jennifer Ln
- 1115 Brookhaven Ct
- 12433 Raindrop Ln
- 1701 Kruse Loop
- 2415 Kruse Loop
- 5520 Bundy Dr
- 38118 Annie Brown Rd
- 20377 Congo Ferndale Rd
- Lot 6 Avilla Manor Subdivision
- 394 E Lawson Rd
- 16474 Congo Ferndale Rd
- 16910 Congo Ferndale Rd
- 20 W Lawson Rd
- 363 E Lawson Rd
- 403 E Lawson Rd
- 510 E Lawson Rd
- 16324 Deerrun Rd
- lot 8 Deerrun Rd
- 489 E Lawson Rd
- 16305 Deerrun Rd
- 17000 Congo Ferndale Rd
- 0 Deerrun Rd
- 200 W Lawson Rd
- 537 E Lawson Rd
- 17001 Congo Ferndale Rd
- 17006 Congo Ferndale Rd
- 650 E Lawson Rd
- 605 E Lawson Rd
- 15901 Congo Ferndale Rd