Estimated Value: $991,000 - $1,211,000
6
Beds
4
Baths
4,420
Sq Ft
$250/Sq Ft
Est. Value
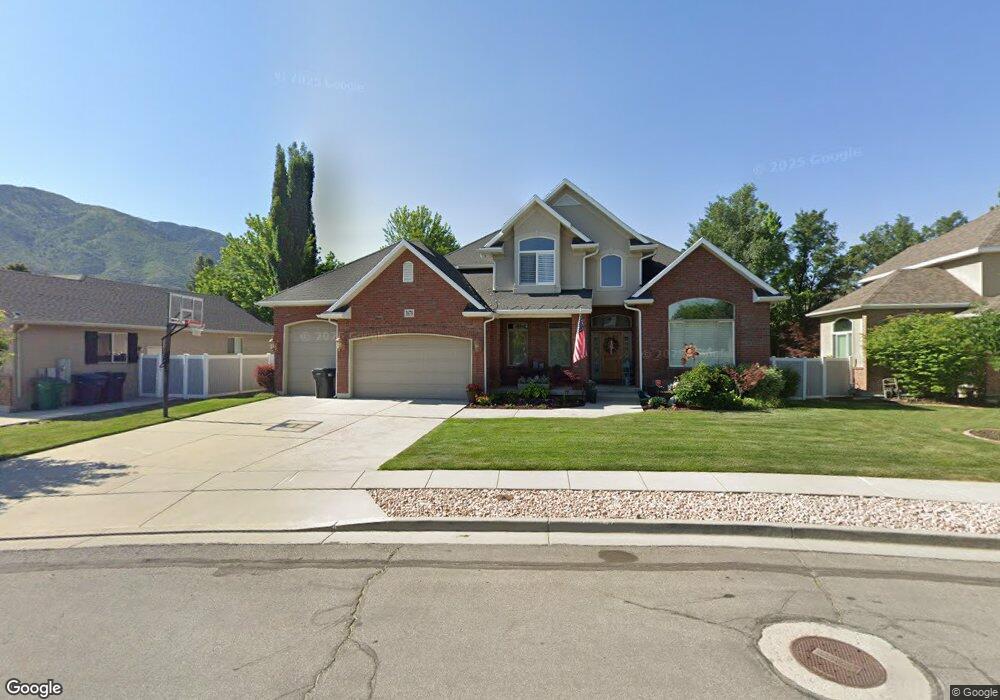
About This Home
This home is located at 1678 E Crescent View Cir, Sandy, UT 84092 and is currently estimated at $1,103,672, approximately $249 per square foot. 1678 E Crescent View Cir is a home located in Salt Lake County with nearby schools including Sunrise Elementary School, Bell Canyon Montessori School, and Challenger School - Sandy.
Ownership History
Date
Name
Owned For
Owner Type
Purchase Details
Closed on
Jul 7, 2015
Sold by
Jones Jillair and Meine Jillair
Bought by
Jones Jillair
Current Estimated Value
Purchase Details
Closed on
Apr 23, 2014
Sold by
Hausman Scott C and Hausman Mary A
Bought by
Meine Jillair
Purchase Details
Closed on
Apr 27, 2007
Sold by
Sirva Relocation Llc
Bought by
Hausman Scott C and Hausman Mary A
Home Financials for this Owner
Home Financials are based on the most recent Mortgage that was taken out on this home.
Original Mortgage
$456,000
Interest Rate
6.15%
Mortgage Type
Purchase Money Mortgage
Purchase Details
Closed on
Apr 24, 2007
Sold by
Al Khalayleh Khalid
Bought by
Al Khalayleh Khalid and Al Khalayleh Andrea F
Home Financials for this Owner
Home Financials are based on the most recent Mortgage that was taken out on this home.
Original Mortgage
$456,000
Interest Rate
6.15%
Mortgage Type
Purchase Money Mortgage
Purchase Details
Closed on
Apr 14, 2007
Sold by
Coram John and Coram Tracy A
Bought by
Sirva Relocation Llc
Home Financials for this Owner
Home Financials are based on the most recent Mortgage that was taken out on this home.
Original Mortgage
$456,000
Interest Rate
6.15%
Mortgage Type
Purchase Money Mortgage
Purchase Details
Closed on
Jan 3, 2006
Sold by
Coram Tracy A
Bought by
Coram John and Coram Tracy A
Home Financials for this Owner
Home Financials are based on the most recent Mortgage that was taken out on this home.
Original Mortgage
$388,880
Interest Rate
1.27%
Mortgage Type
Fannie Mae Freddie Mac
Purchase Details
Closed on
Nov 13, 2001
Sold by
Stone James A
Bought by
Stone James A and Stone Vicki B
Home Financials for this Owner
Home Financials are based on the most recent Mortgage that was taken out on this home.
Original Mortgage
$275,000
Interest Rate
6.62%
Purchase Details
Closed on
Nov 11, 2001
Sold by
Steven Dailey Construction Inc
Bought by
Stone James A
Home Financials for this Owner
Home Financials are based on the most recent Mortgage that was taken out on this home.
Original Mortgage
$275,000
Interest Rate
6.62%
Purchase Details
Closed on
Dec 5, 2000
Sold by
Sunrise Capital Llc
Bought by
Steven Dailey Construction Inc
Home Financials for this Owner
Home Financials are based on the most recent Mortgage that was taken out on this home.
Original Mortgage
$306,400
Interest Rate
7.66%
Create a Home Valuation Report for This Property
The Home Valuation Report is an in-depth analysis detailing your home's value as well as a comparison with similar homes in the area
Home Values in the Area
Average Home Value in this Area
Purchase History
| Date | Buyer | Sale Price | Title Company |
|---|---|---|---|
| Jones Jillair | -- | None Available | |
| Meine Jillair | -- | Us Title | |
| Hausman Scott C | -- | Bonneville Superior Title | |
| Al Khalayleh Khalid | -- | Pinnacle Title Co | |
| Sirva Relocation Llc | -- | Bonneville Superior Title | |
| Coram John | -- | Cottonwood Title Ins Agency | |
| Coram Tracy A | -- | Cottonwood Title Ins Agency | |
| Stone James A | -- | -- | |
| Stone James A | -- | Paramount Title | |
| Steven Dailey Construction Inc | -- | Paramount Title |
Source: Public Records
Mortgage History
| Date | Status | Borrower | Loan Amount |
|---|---|---|---|
| Previous Owner | Hausman Scott C | $456,000 | |
| Previous Owner | Sirva Relocation Llc | $85,500 | |
| Previous Owner | Coram Tracy A | $388,880 | |
| Previous Owner | Stone James A | $275,000 | |
| Previous Owner | Steven Dailey Construction Inc | $306,400 | |
| Closed | Stone James A | $70,000 |
Source: Public Records
Tax History
| Year | Tax Paid | Tax Assessment Tax Assessment Total Assessment is a certain percentage of the fair market value that is determined by local assessors to be the total taxable value of land and additions on the property. | Land | Improvement |
|---|---|---|---|---|
| 2025 | $5,118 | $925,500 | $318,400 | $607,100 |
| 2024 | $5,118 | $946,500 | $306,400 | $640,100 |
| 2023 | $4,728 | $871,800 | $294,700 | $577,100 |
| 2022 | $5,113 | $921,100 | $288,900 | $632,200 |
| 2021 | $4,676 | $717,100 | $259,700 | $457,400 |
| 2020 | $4,441 | $642,100 | $259,700 | $382,400 |
| 2019 | $4,544 | $640,300 | $245,000 | $395,300 |
| 2018 | $4,304 | $631,500 | $245,000 | $386,500 |
| 2017 | $4,233 | $593,300 | $245,000 | $348,300 |
| 2016 | $3,765 | $510,100 | $220,800 | $289,300 |
| 2015 | $4,326 | $542,400 | $234,000 | $308,400 |
| 2014 | $3,853 | $473,500 | $227,400 | $246,100 |
Source: Public Records
Map
Nearby Homes
- 1653 Crescent View Dr
- 11341 S Silver Buckle Way
- 11318 Canyon Falls Ln
- 11382 S Canyon Falls Ln
- 11037 E Robinson Curcle
- 1935 Brandon Park Place
- 1320 E Woodhill Cir
- 10868 Prescott Dr
- 1234 E Sandy Ridge Dr
- 11404 High Mesa Dr
- 11755 S Canberra Dr
- 10695 S Dielsdorf Rd
- 11129 S 2125 E
- 1129 E Sanders Rd
- 2148 E Pinecrest Ln
- 2122 Wasatch Blvd
- 2026 E 10765 S
- 2234 E Willow Brook Way
- 7 Rollingwood Ln
- 2192 E High Mesa Dr
- 1678 Crescent View Cir
- 1678 Crescent View Cir Unit 2
- 1678 Crescent View Dr
- 1666 Crescent View Cir
- 1690 Crescent View Cir
- 1690 Crescent View Cir Unit 1
- 1690 E Crescent View Cir
- 11302 S Blue Roan Ln
- 11302 Blue Roan Ln
- 11301 S Blue Roan Ln
- 11303 Four Sox Cove
- 11301 Blue Roan Ln
- 11314 Blue Roan Ln
- 11314 S Blue Roan Ln
- 1654 Crescent View Cir
- 1677 Crescent View Dr
- 1677 Crescent View Cir
- 1677 E Crescent View Cir
- 11313 Four Sox Cove
- 11313 Four Sox Cove Unit 105
Your Personal Tour Guide
Ask me questions while you tour the home.